Dashboard
An at-a-glance summary of your active resources, hourly cost, and credit balance after you sign in.
The Hyperstack Dashboard is the first page you see after you sign in to the console. It gives you an at-a-glance summary of your active cloud resources and their hourly cost alongside your current credit balance, with shortcuts to manage each from one place. This page explains every section of the Dashboard and how to use it to monitor your account.
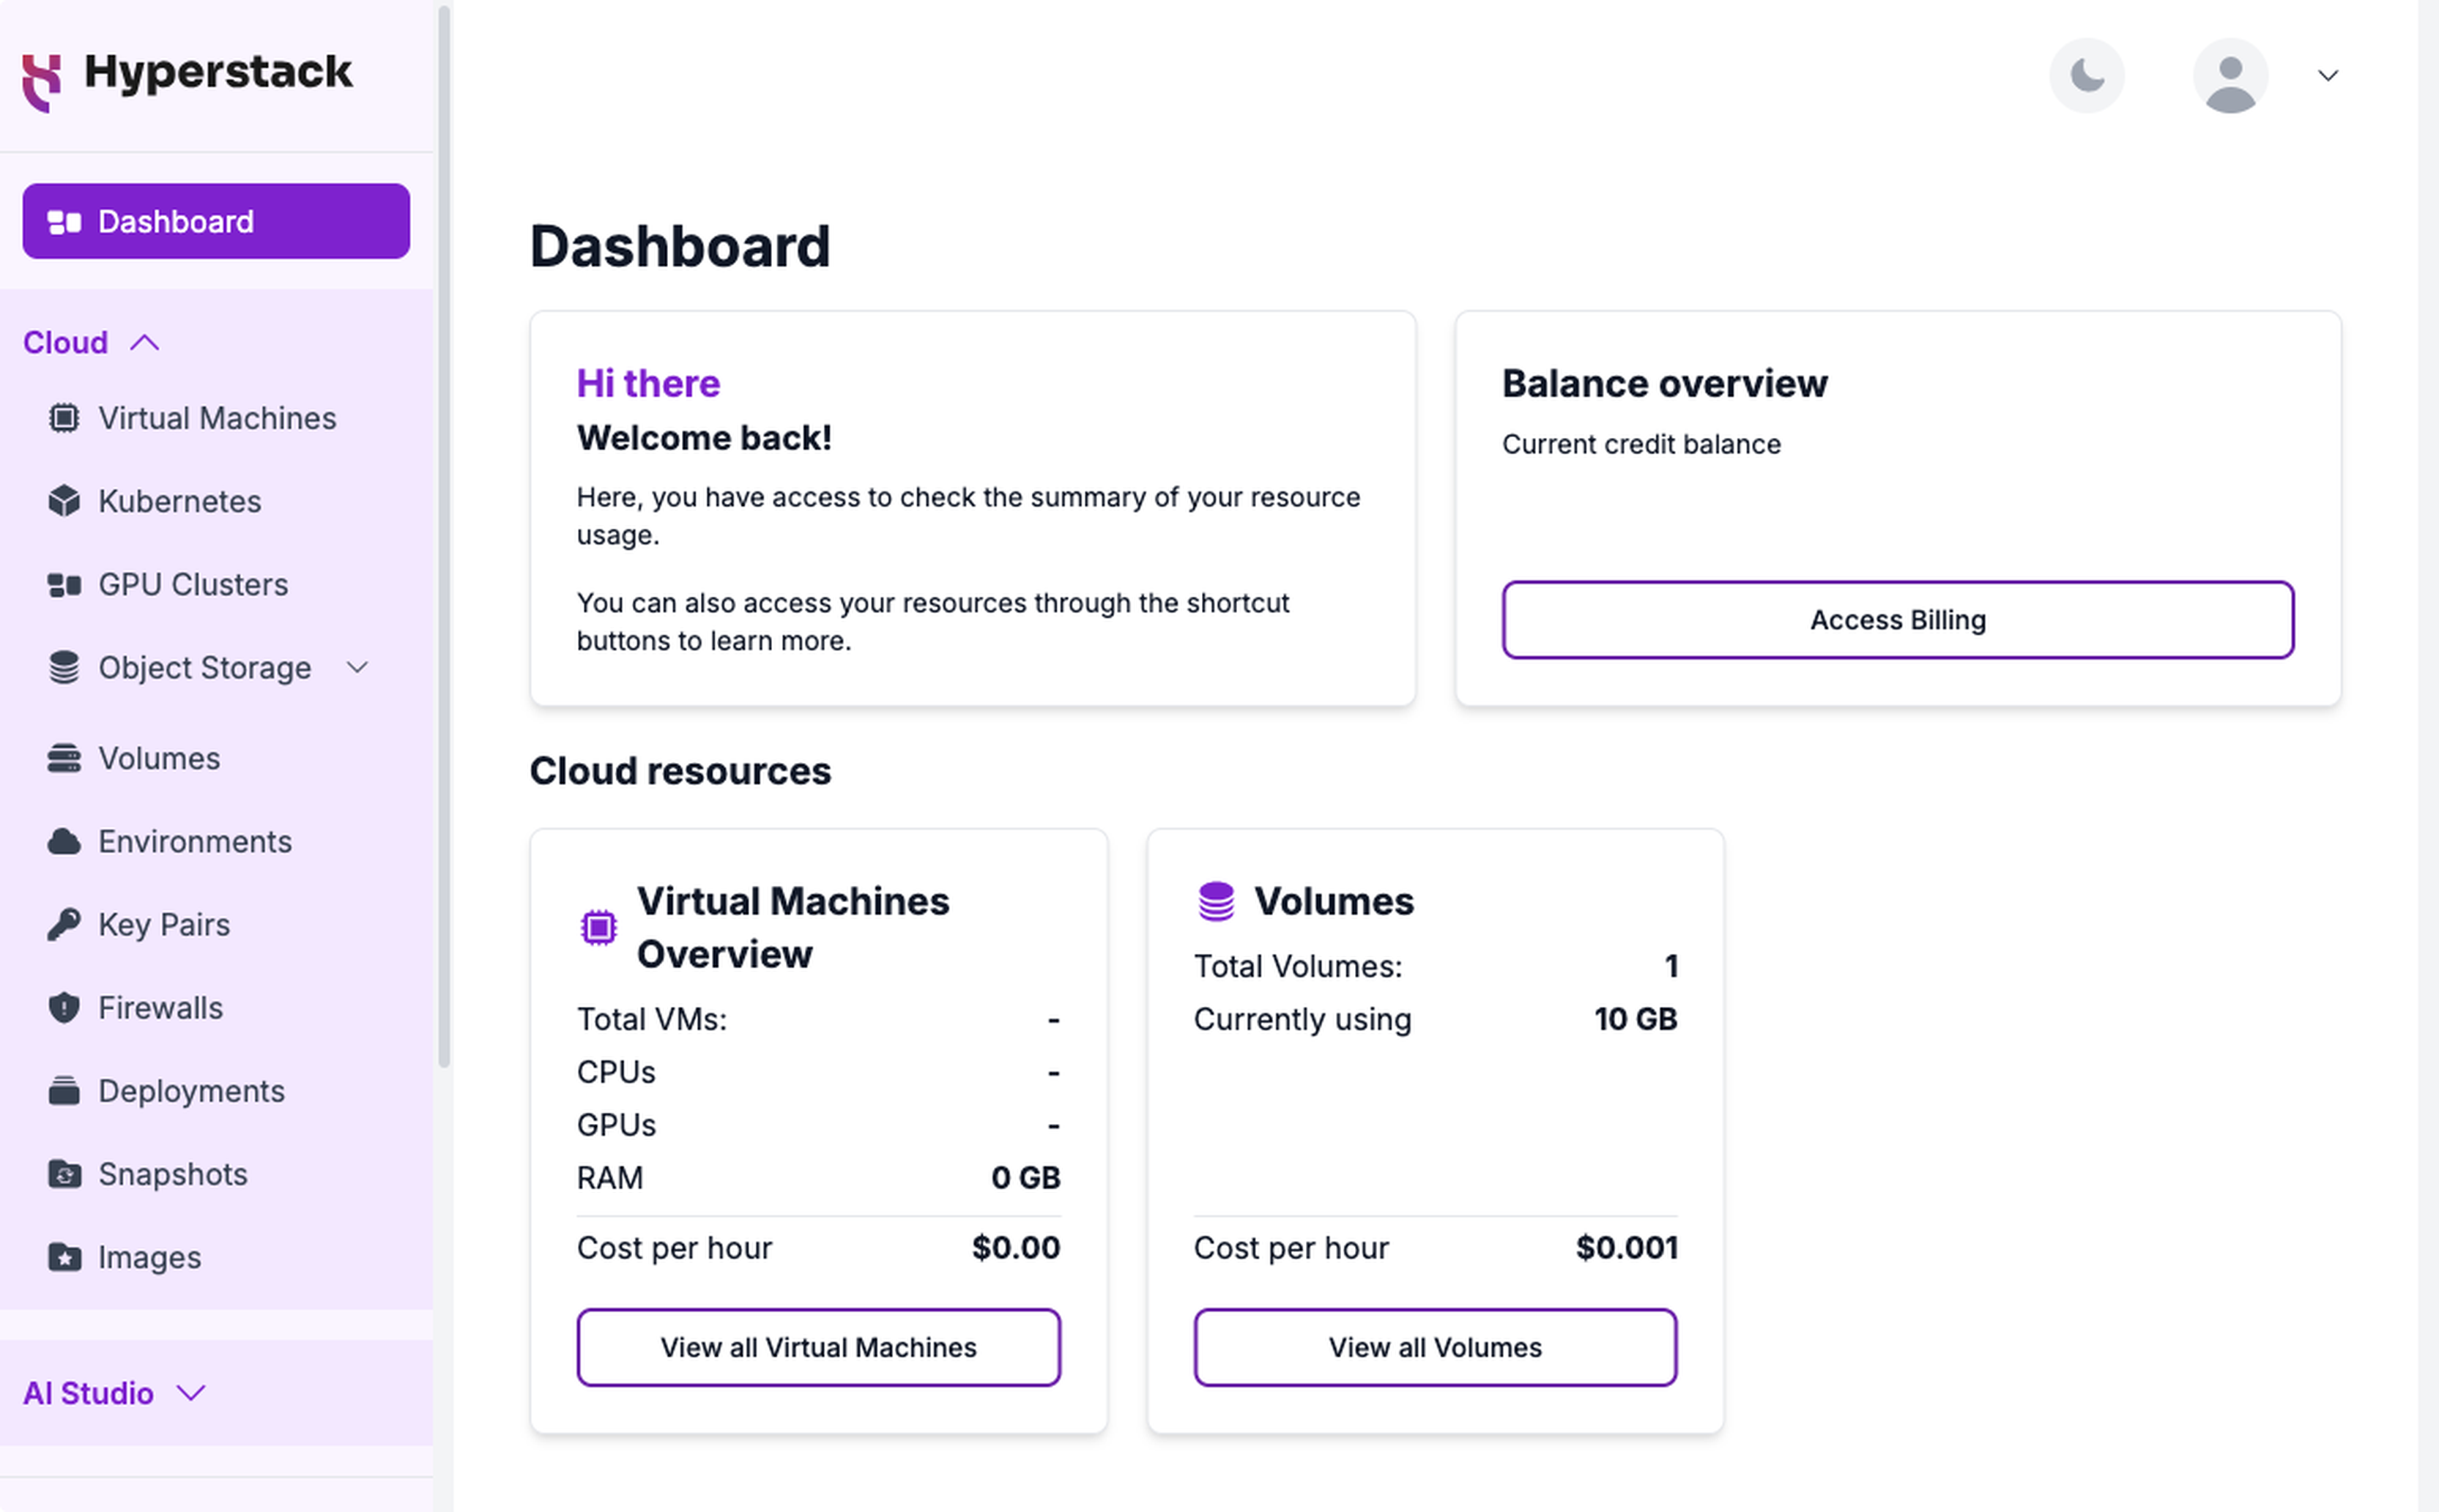
The Dashboard is a monitoring view. You deploy and manage resources from their dedicated pages in the sidebar, such as Virtual Machines and Volumes, then return here to track them at a glance.
Accessing the Dashboard
The Dashboard opens automatically after you sign in, with a short greeting and a summary of what you can do from the page. To return to it at any time, select Dashboard at the top of the sidebar.
The top navigation bar stays visible on every console page and gives you account-wide controls wherever you are:
- Current credit balance: your live account balance, shown on the right of the bar. This is the same value as the Balance overview card below.
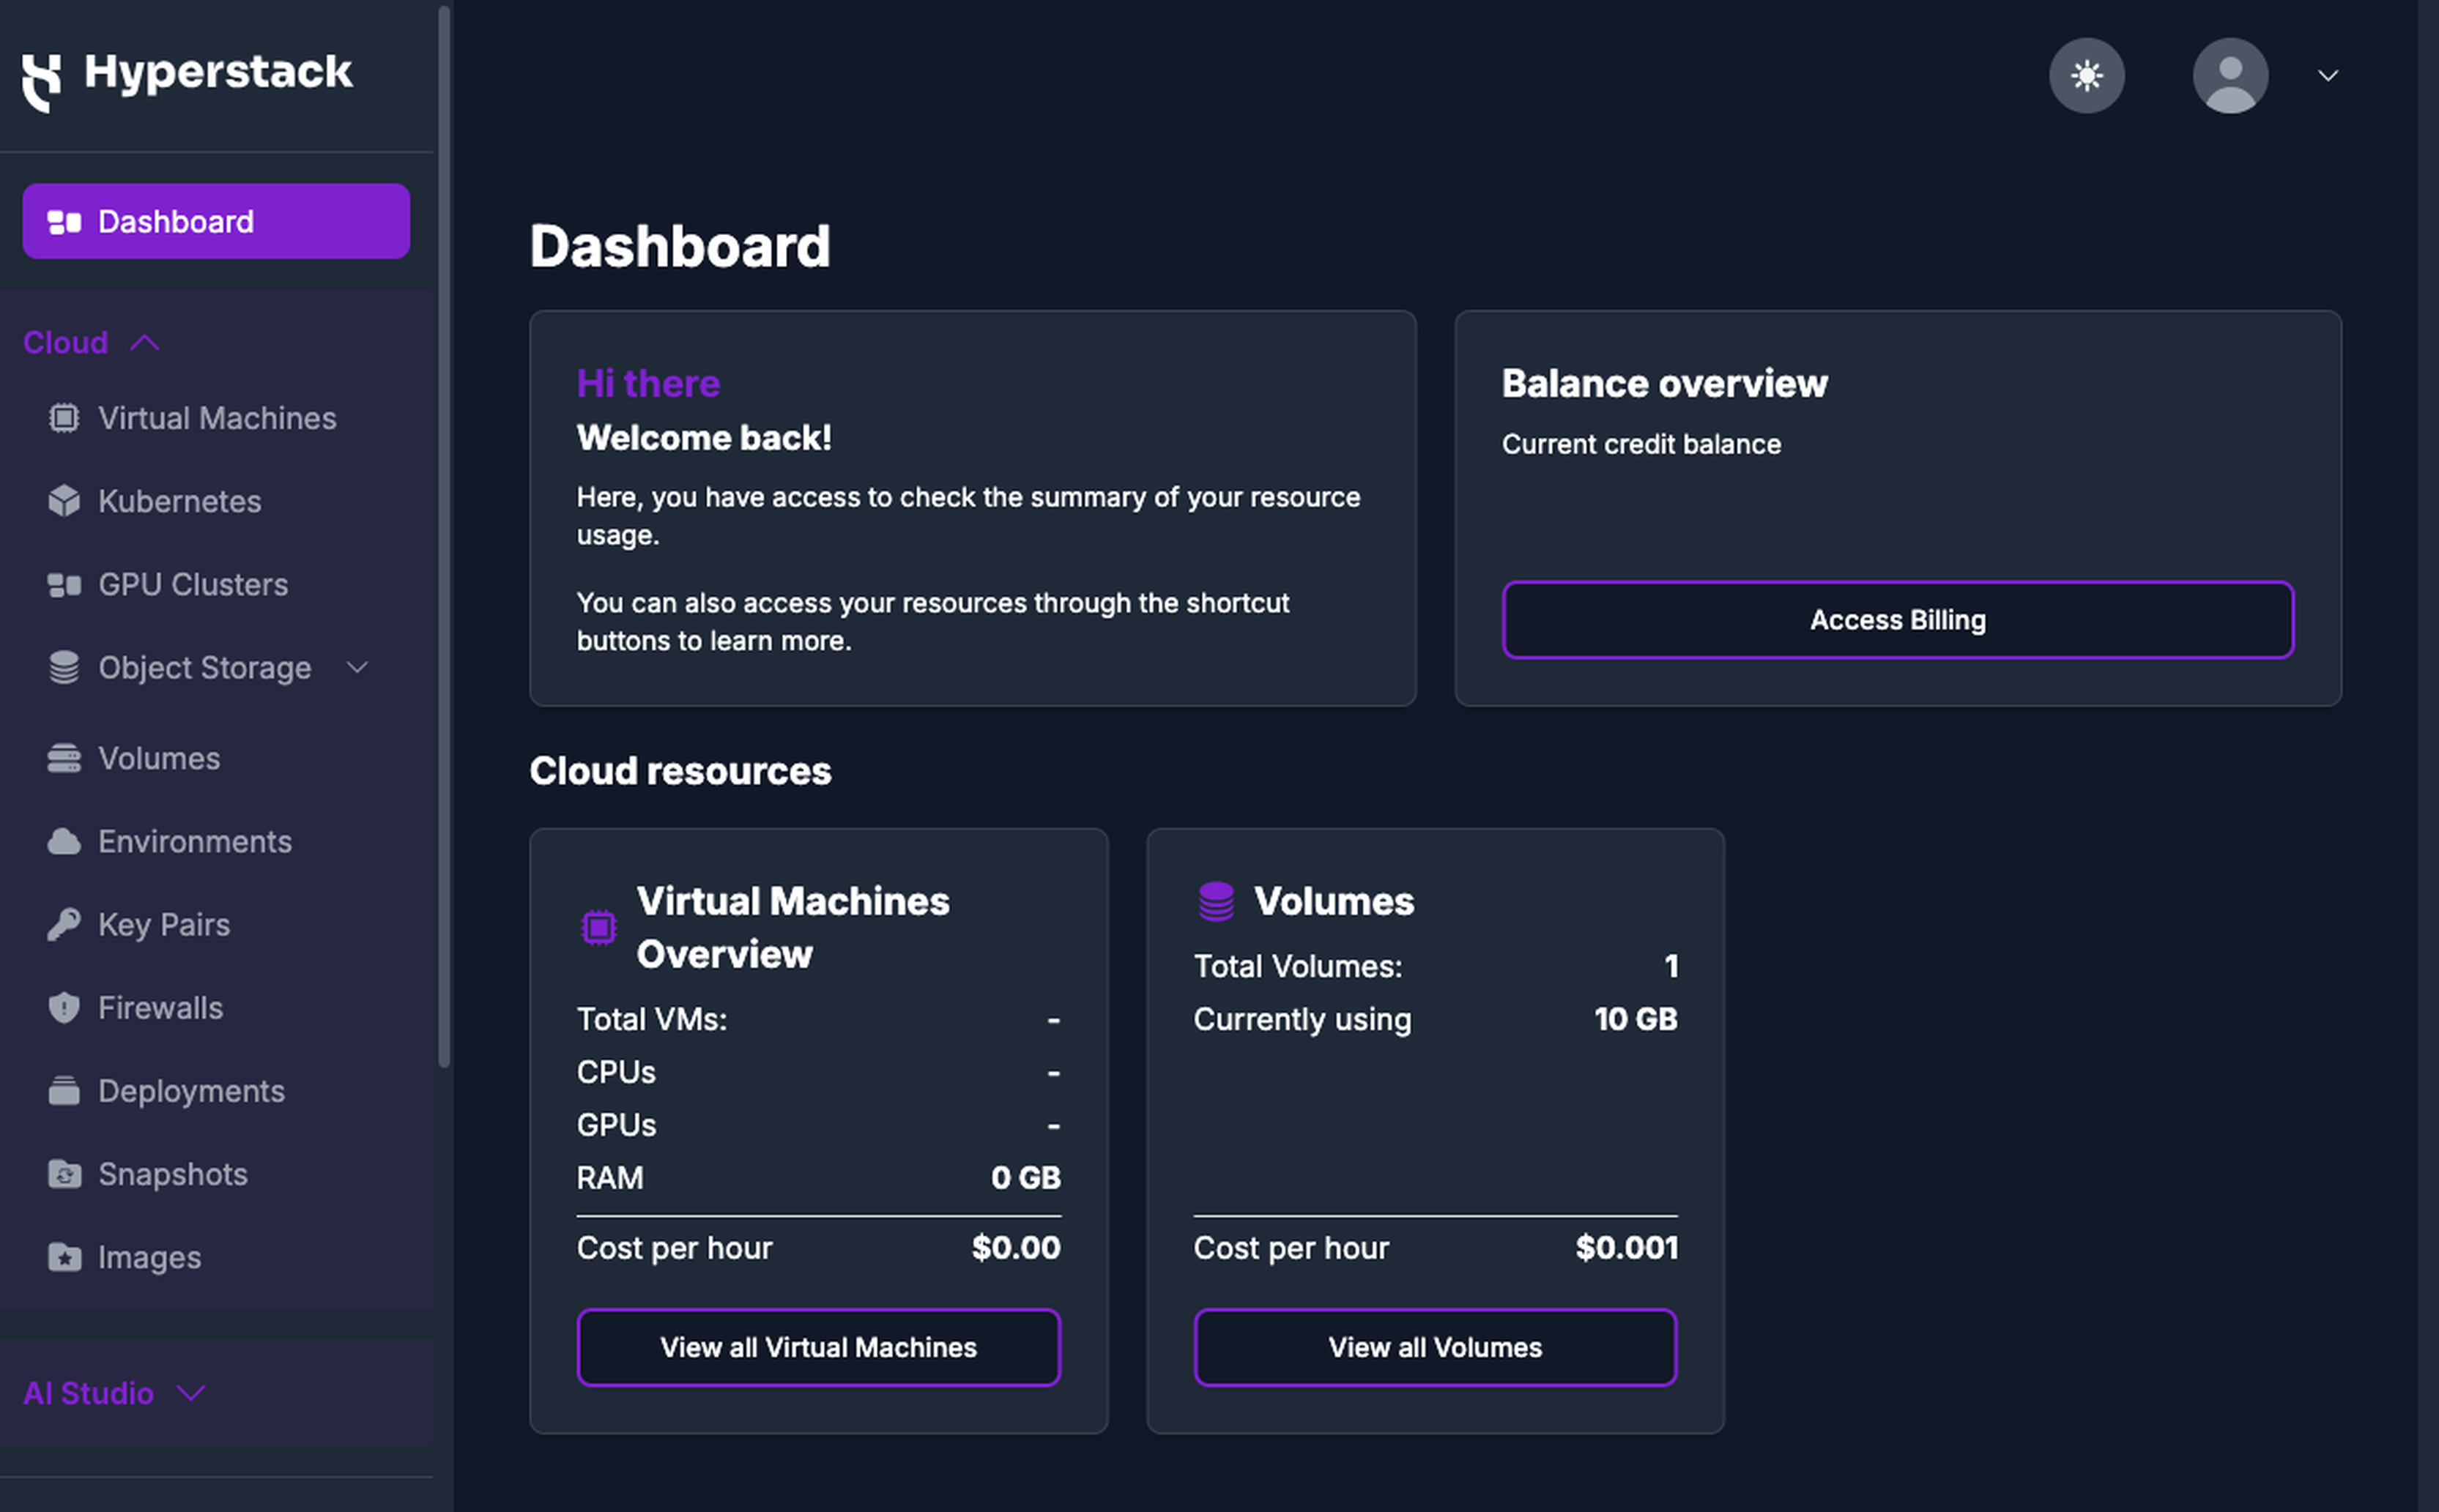
- Theme toggle: switches the console between light and dark mode.
- Account menu: select your name to open the My Account page.
Balance overview
The Balance overview card shows your Current credit balance, the funds available to run your resources. The same balance appears in the top navigation bar on every console page, so you can keep an eye on it as you work.
Select Access Billing to open the Billing page, where you can top up credit, redeem vouchers, and review your usage and payment history.
Your balance determines whether you can deploy new resources and how long your existing ones keep running. For the minimum balance required to deploy a virtual machine, the low-balance email notifications, and what happens when your credit runs out, see Billing policies.
Cloud resources
The Cloud resources section summarizes your active virtual machines and volumes in two cards. The figures are aggregated across every environment and region in your account, so each card reflects your whole account rather than a single environment. Other resource types, such as Kubernetes clusters and object storage, are managed from their own pages in the sidebar and are not summarized here.
Virtual Machines
The Virtual Machines Overview card aggregates the compute you currently have running:
| Field | Description |
|---|---|
| Total VMs | Number of active virtual machines across all environments. |
| CPUs | Total CPU cores allocated to those virtual machines. |
| GPUs | Total GPUs allocated to those virtual machines. |
| RAM | Total memory allocated, in GB. |
| Cost per hour | Combined hourly cost of every running virtual machine. |
When you have no virtual machines, Total VMs, CPUs, and GPUs show a dash (-), RAM shows 0 GB, and Cost per hour shows $0.00. Select View all Virtual Machines to open the Virtual Machines page and manage each one.
Volumes
The Volumes card aggregates your block storage:
| Field | Description |
|---|---|
| Total Volumes | Number of volumes in your account. |
| Currently using | Total provisioned storage, in GB. |
| Cost per hour | Combined hourly cost of every volume. |
Volumes bill independently of virtual machines and continue to incur cost while they exist, even when no virtual machine is attached. Select View all Volumes to open the Volumes page.