Enhanced Monitoring
Collect high-granularity system, GPU, and inference serving metrics from a virtual machine and query them in the console, in Grafana, or through a Prometheus-compatible API.
Enhanced Monitoring runs a lightweight agent inside your virtual machine that collects system and GPU metrics at a much finer granularity than the standard Performance Metrics view. It adds per-device GPU data, including utilization, memory, temperature, and power draw. On a virtual machine that serves a dedicated inference endpoint, it is on by default and also reports serving metrics, such as request load, token throughput, and latency. Once the agent is reporting, you can read the metrics in Hyperstack, query them from your own Grafana instance, or call a Prometheus-compatible API directly. This page explains what the agent collects, how to turn Enhanced Monitoring on and off, and how to query the results.
Enhanced Monitoring Overview
Every virtual machine reports a basic set of metrics without any agent. Enhanced Monitoring adds a second, richer tier on top of that baseline, so you choose between two modes per VM:
| Mode | What it collects |
|---|---|
| Standard mode | CPU, RAM, and coarse disk I/O |
| Enhanced mode | GPU utilization, temperature, power draw, fan speed, RAM, and finer disk I/O with longer retention |
The agent runs as a service inside your VM and posts metrics to Hyperstack on a short interval. Each metric is tagged with your organization, the VM, its environment, region, and flavor, and only members of your organization can read it.
Metrics collected
The agent runs the groups of collectors outlined below. Every metric is prefixed with hyperstack_, so it is easy to filter against in PromQL.
System metrics
- CPU time per core, broken down by
user,system,idle, andiowait - Memory: total, available, active, and inactive
- Filesystem: total size, free space, available space, and usage percentage per mounted filesystem
- Disk I/O per device: bytes read and written, completed read and write operations, and time spent on read and write
- Network I/O per interface: bytes and packets sent and received, plus error counters
- System load average over 1, 5, and 15 minutes
- Host info: boot time, kernel version, and architecture
GPU metrics (NVIDIA)
The agent collects GPU metrics per device, so a multi-GPU VM reports each GPU separately.
GPU metrics require two things: a GPU flavor, and the NVIDIA driver installed inside the VM. The agent reads them with nvidia-smi, so a VM without the driver reports everything except GPU metrics, even when it has GPUs attached.
Deploy from a Driver/CUDA pre-installed image to get both without extra setup. On a bare image, such as Debian or AlmaLinux, install the NVIDIA driver yourself first. You can confirm the driver is present by running nvidia-smi in the VM.
- Utilization: GPU compute utilization and memory bandwidth utilization
- Memory: total, used, and free
- Temperature
- Power draw
- Fan speed, on GPUs that report one
Dedicated inference metrics
On a virtual machine that serves a dedicated inference endpoint, the agent also collects serving metrics from the inference engine. Every series is prefixed hyperstack_dedicated_inference_ and carries a model_name label.
- Latency: end-to-end request latency, time to first token, time between tokens, and time per output token, plus the time each request spends queued, in prefill, in decode, and running
- Tokens: prompt tokens processed, broken down by source, prompt tokens served from cache, and tokens generated
- Token distributions: prompt and generated tokens per request, the maximum generation tokens per request, key-value tokens newly computed during prefill, and tokens processed per engine step
- Cache: key-value cache usage, and hits and queries for the prefix cache, the prefix cache shared across instances, and the multimodal cache
- Scheduling: requests running, requests waiting, waiting requests split by whether they wait for capacity or are deferred, and preemptions
- Requests: finished requests by how they ended, and the
max_tokensandnvalues that requests set - Resource estimates per GPU: floating-point operations, and bytes read and written
- Engine state: whether the engine is awake or sleeping, and at which sleep level
The console summarises these on a Dedicated Inference sub-tab. The complete set is available through Grafana and the Prometheus-compatible API. Latency, token distributions, and the max_tokens and n values are histograms, so use histogram_quantile to read percentiles from them.
Agent self-metrics
The agent also reports on its own health, which is what the console reads to show whether monitoring is live:
hyperstack_agent_up: whether the agent is reportinghyperstack_agent_build_info: agent version and build informationhyperstack_agent_collectors_runningandhyperstack_agent_collector_enabled: which collectors are active- Number of samples submitted and submission failure counts
- Time taken to collect and submit each batch
How Enhanced Monitoring works
Enabling Enhanced Monitoring records your choice against the VM, and metrics start flowing once the agent is installed and running inside it:
- On a new VM, leave the toggle on when you deploy and Hyperstack installs the agent on first boot.
- On an existing VM, switching to Enhanced mode returns a one-line install command that you run inside the VM yourself.
- The agent collects each group of metrics on its own interval and posts them to Hyperstack.
- Your metrics are stored against your organization, and only members of your organization can query them.
- Hyperstack exposes a Prometheus-compatible read API, so you can connect Grafana or call the API directly.
- If you switch back to Standard mode, the agent stops collecting and submitting on its next sync. It stays installed and resumes when you switch back to Enhanced mode.
You do not manage agent credentials. The agent authenticates itself from inside the VM, so no API key is stored on the machine.
Enable Enhanced Monitoring on a New Virtual Machine
Choose whether a virtual machine collects enhanced metrics before you deploy it. The toggle in the VM creation form is on by default, so leave it on to have the agent installed at first boot, or switch it off to deploy without Enhanced Monitoring. You can change the setting later at any time from the VM's Overview tab.
-
Open the VM creation form
In Hyperstack, navigate to the Virtual Machines page, click Deploy New Virtual Machine, and configure your VM.
Supported ImagesEnhanced Monitoring requires a Linux image running systemd. For GPU metrics, select a GPU flavor and a Driver/CUDA pre-installed image. The agent reads GPU metrics with
nvidia-smi, so a VM without the NVIDIA driver reports everything except GPU metrics. -
Show the additional settings
Scroll to the bottom of the form and click Configure Additional Settings.
-
Set the Enhanced Monitoring toggle
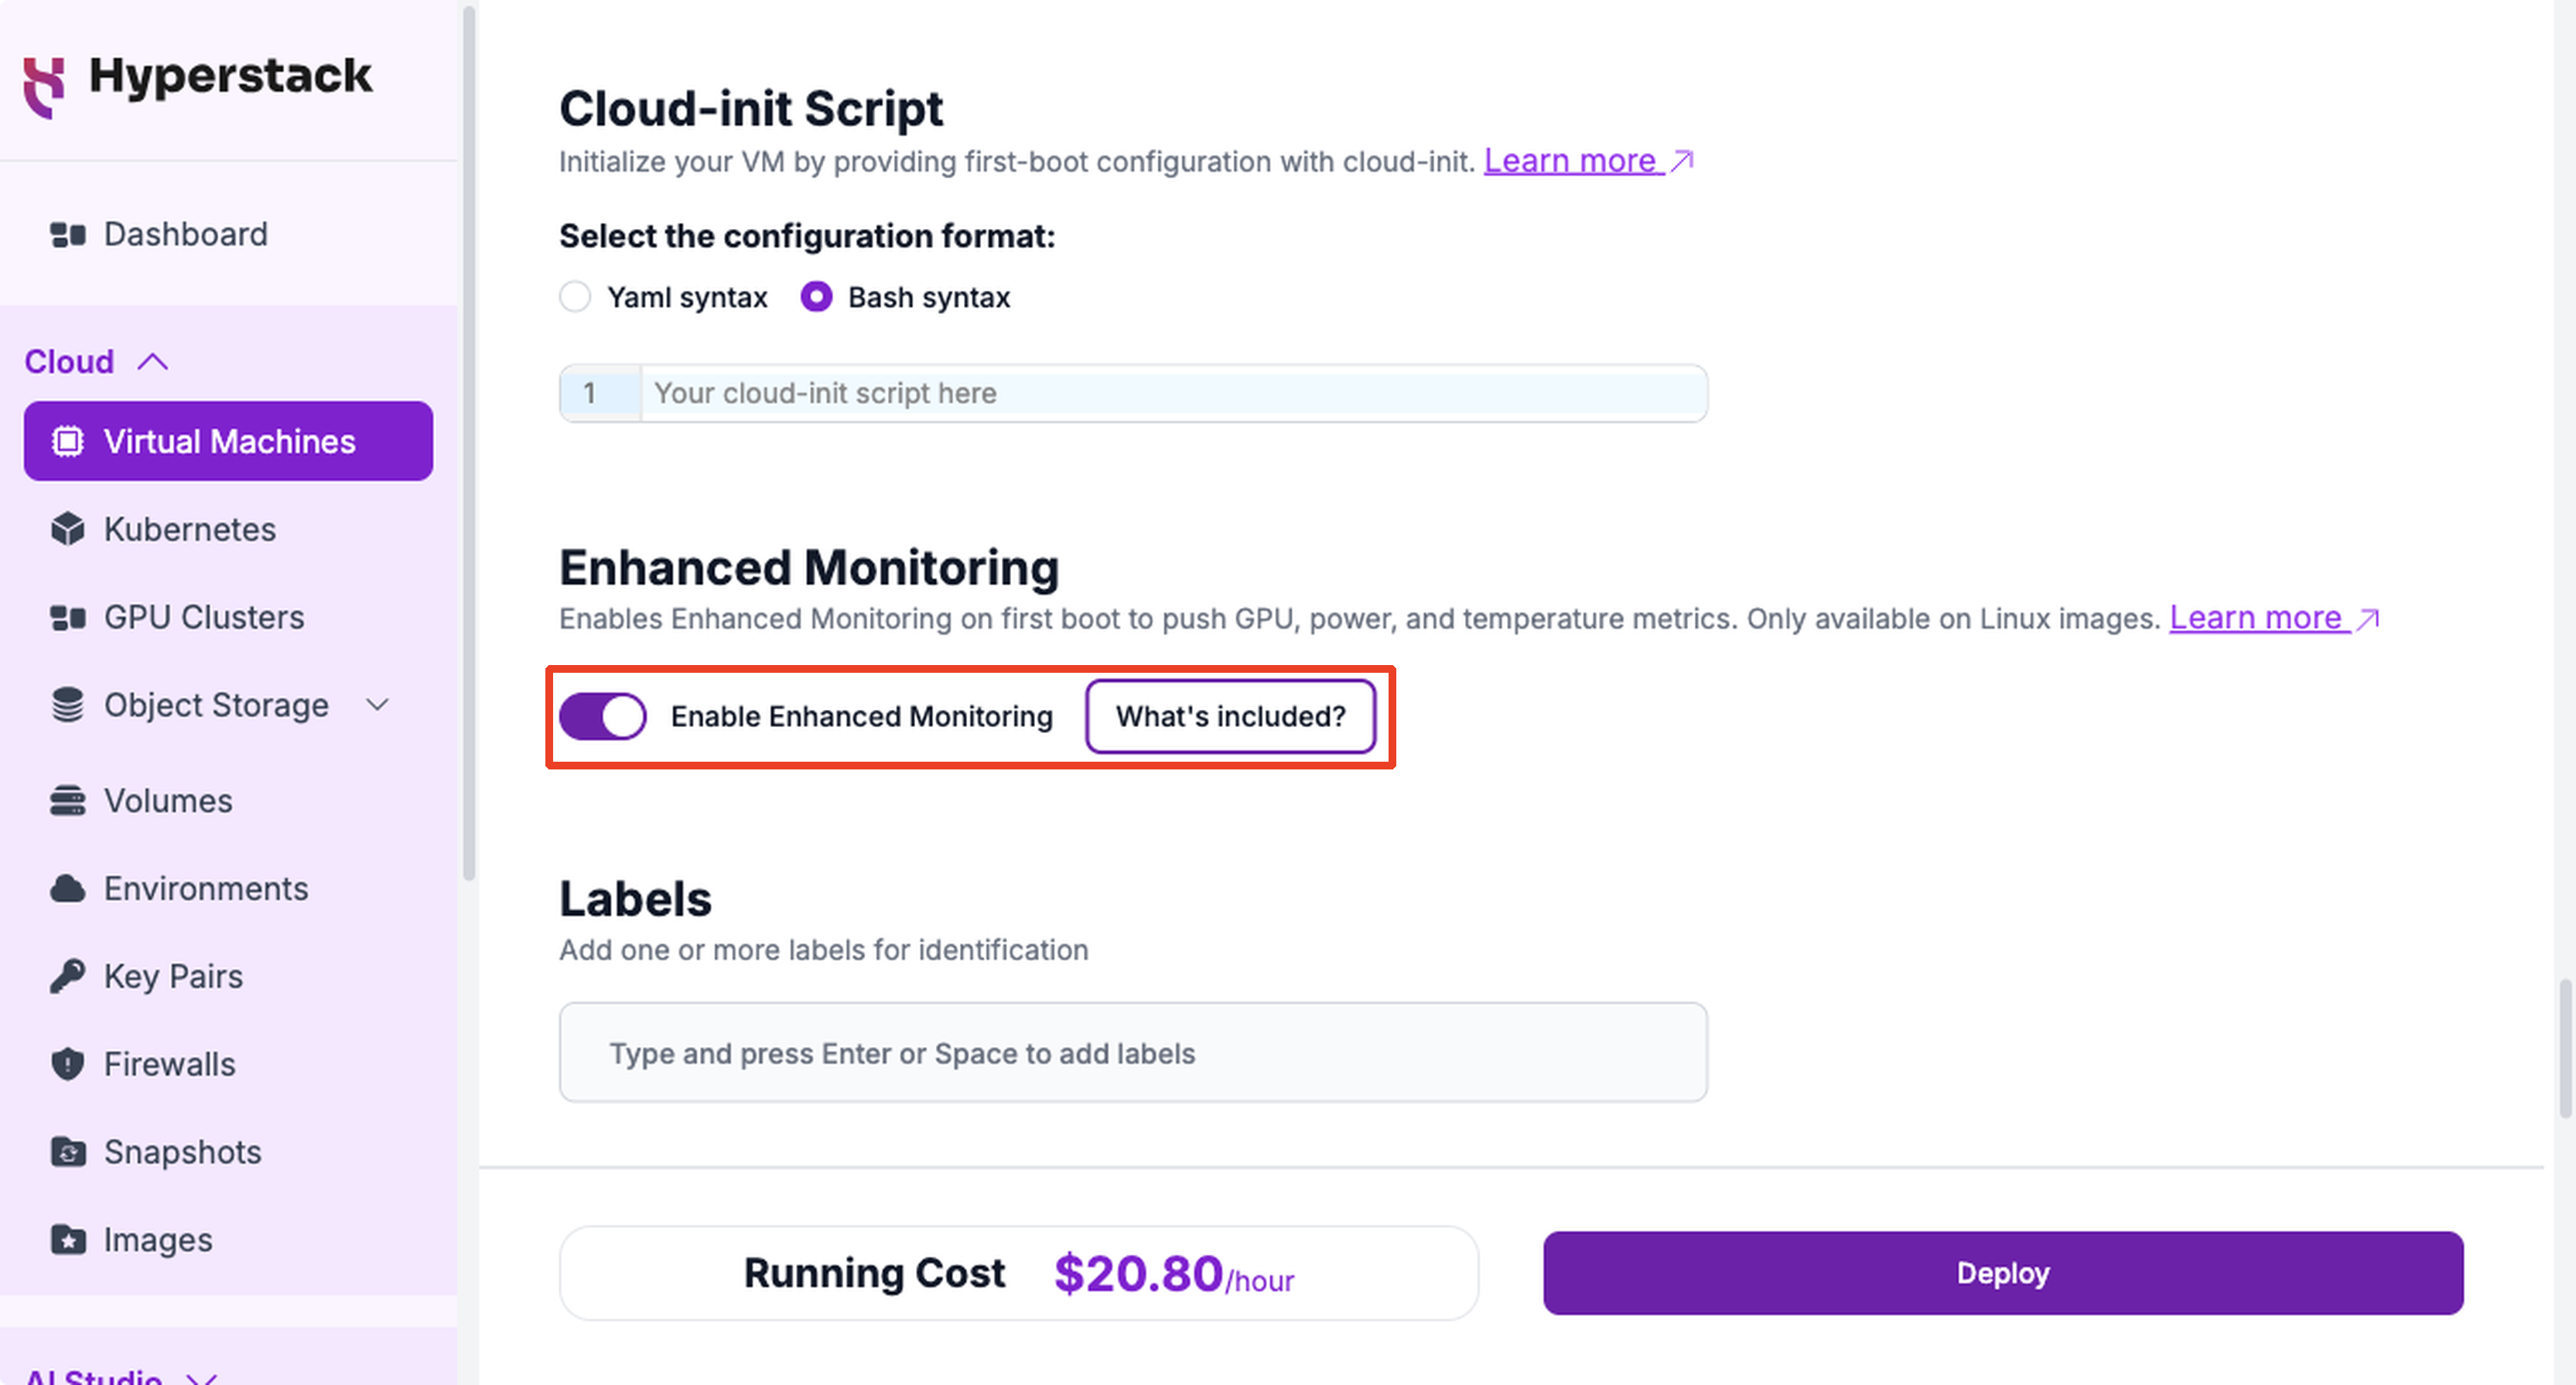
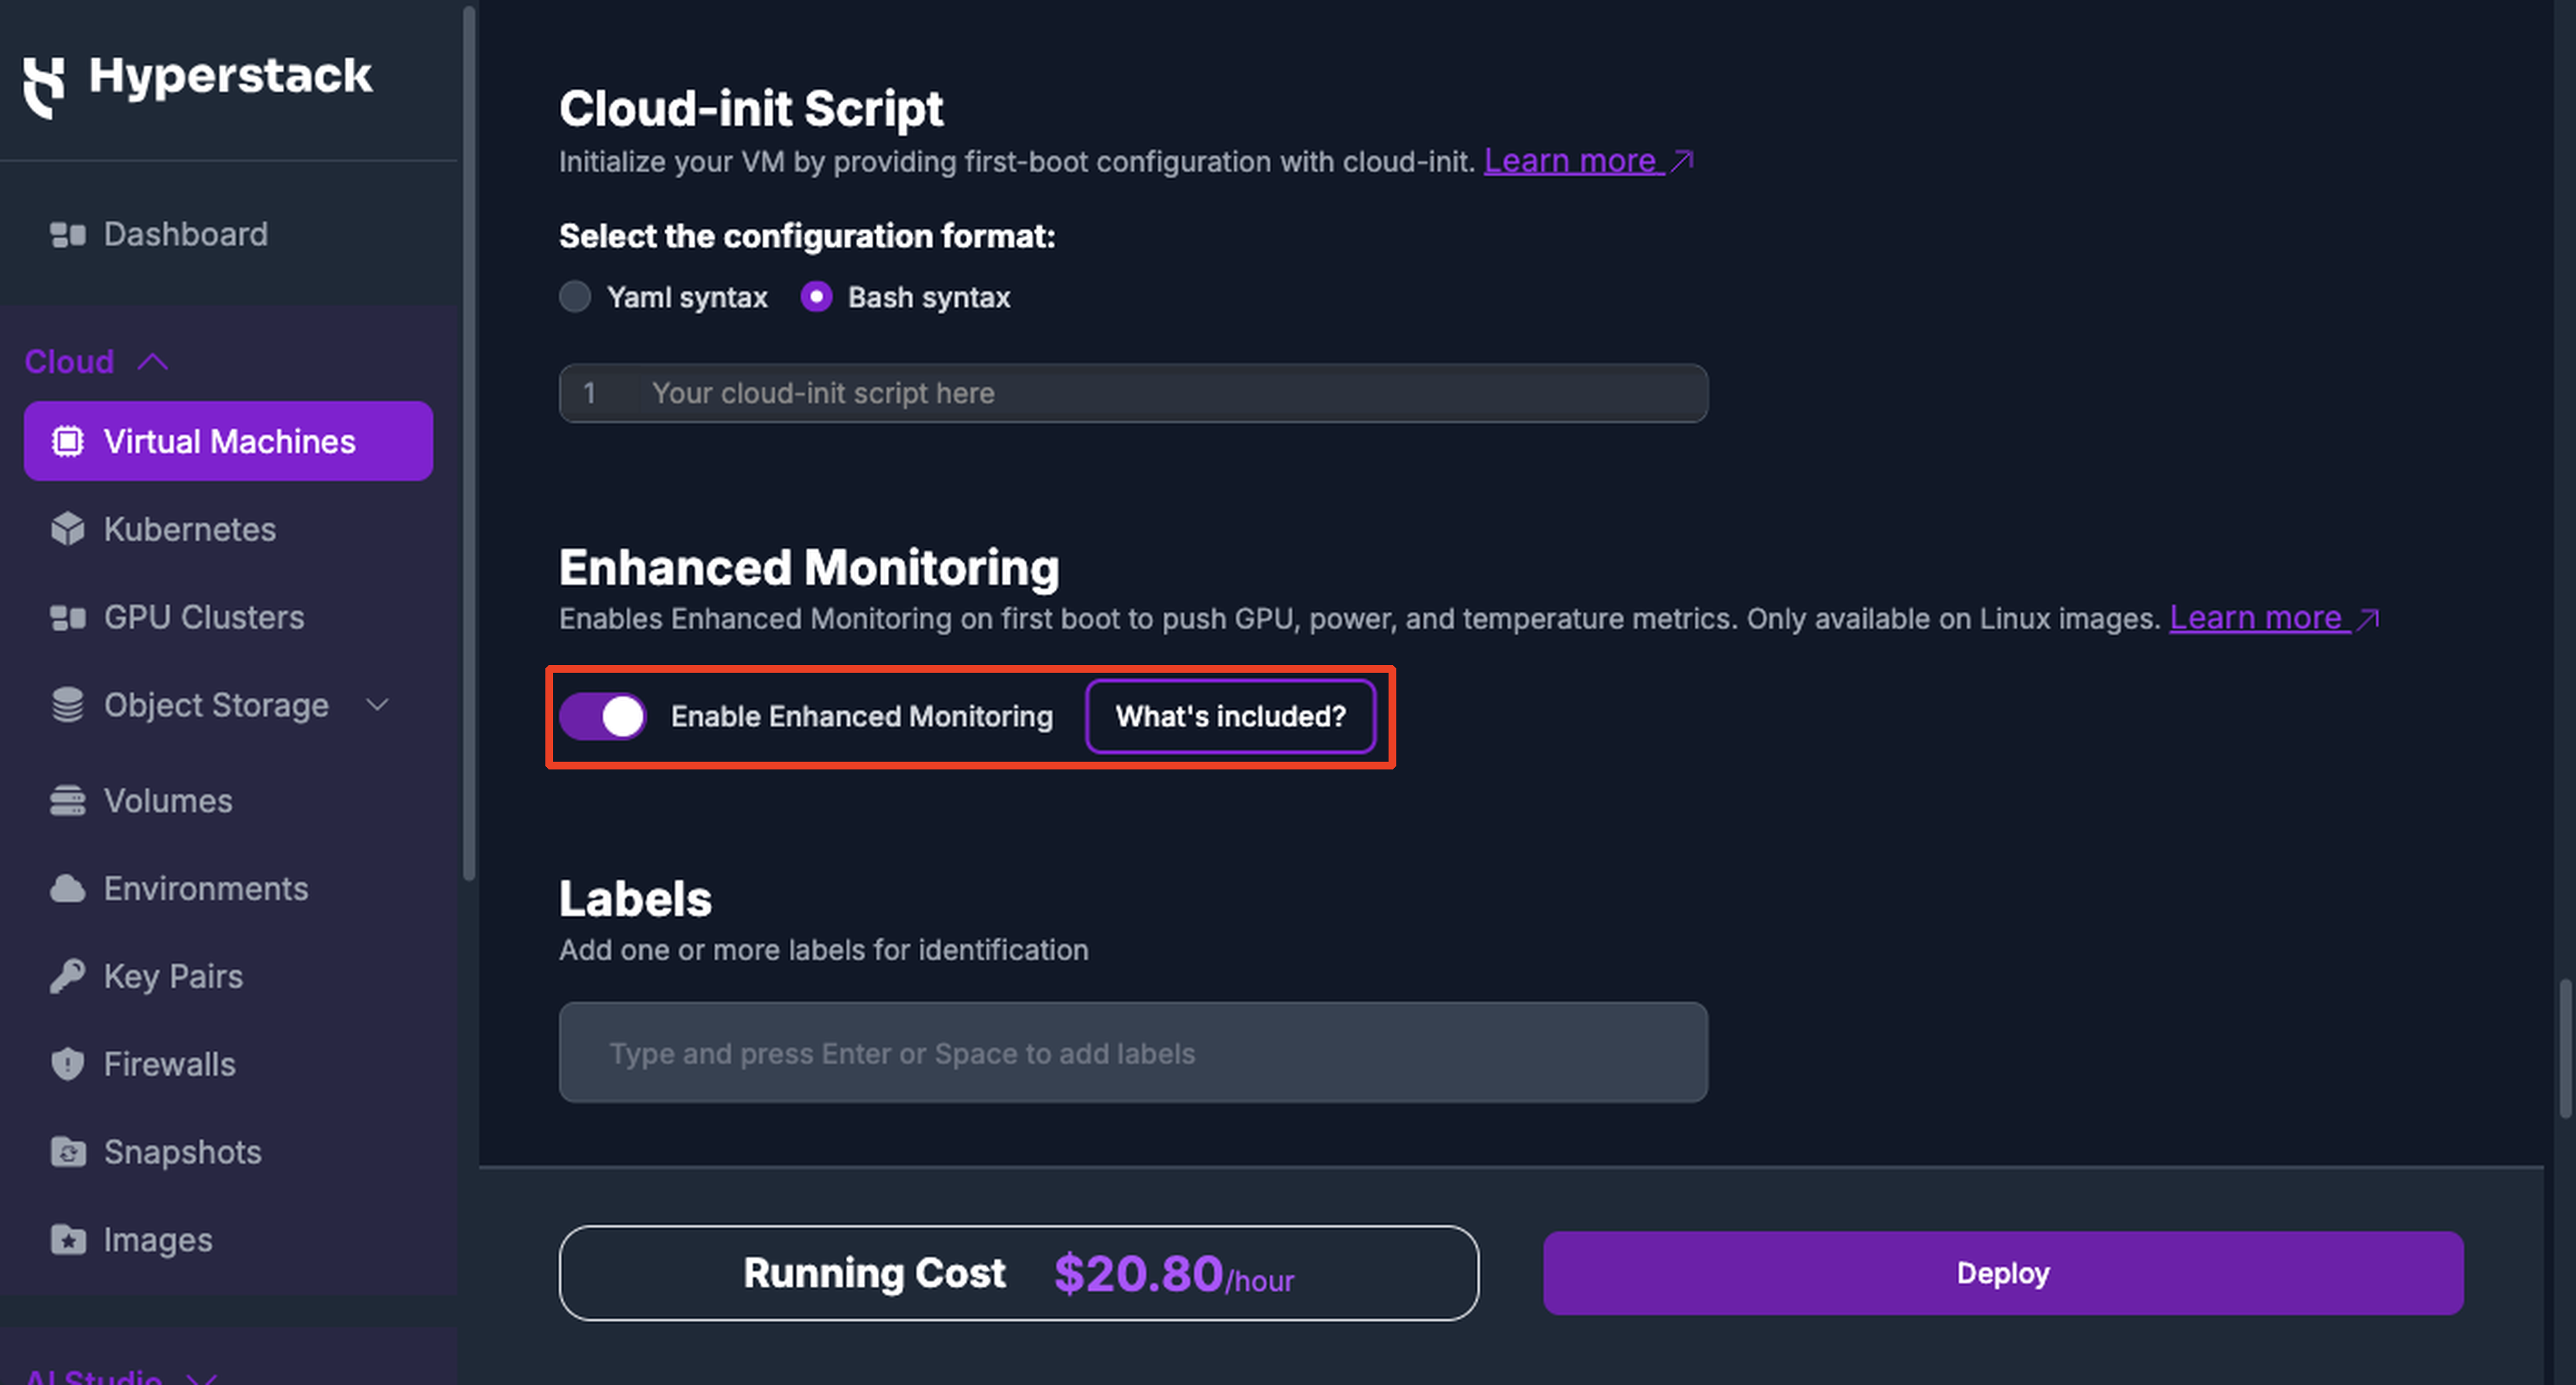
Under Enhanced Monitoring, directly below the Cloud-init Script field, set the Enable Enhanced Monitoring toggle. Leave it on to collect enhanced metrics, or switch it off to deploy without them. To compare what each mode collects, click What's included?.
-
Deploy the VM
Complete the rest of the form and click Deploy. If you left the toggle on, Hyperstack installs and starts the agent during first boot, so allow a few minutes after the VM reaches ACTIVE for the first metrics to arrive.
Deploying via the APIThe Create virtual machines request accepts an
enhanced_monitoring_enabledboolean. It defaults tofalse, so set it explicitly to enable Enhanced Monitoring on a VM you create through the API.
Enable Enhanced Monitoring on an Existing Virtual Machine
You can switch a running virtual machine from Standard to Enhanced mode without recreating it. If the agent is not already installed, this path ends with a command you run inside the VM. On a machine whose agent is already reporting, saving the change confirms straight away and no install step is needed.
-
Open the Enhanced Monitoring setup
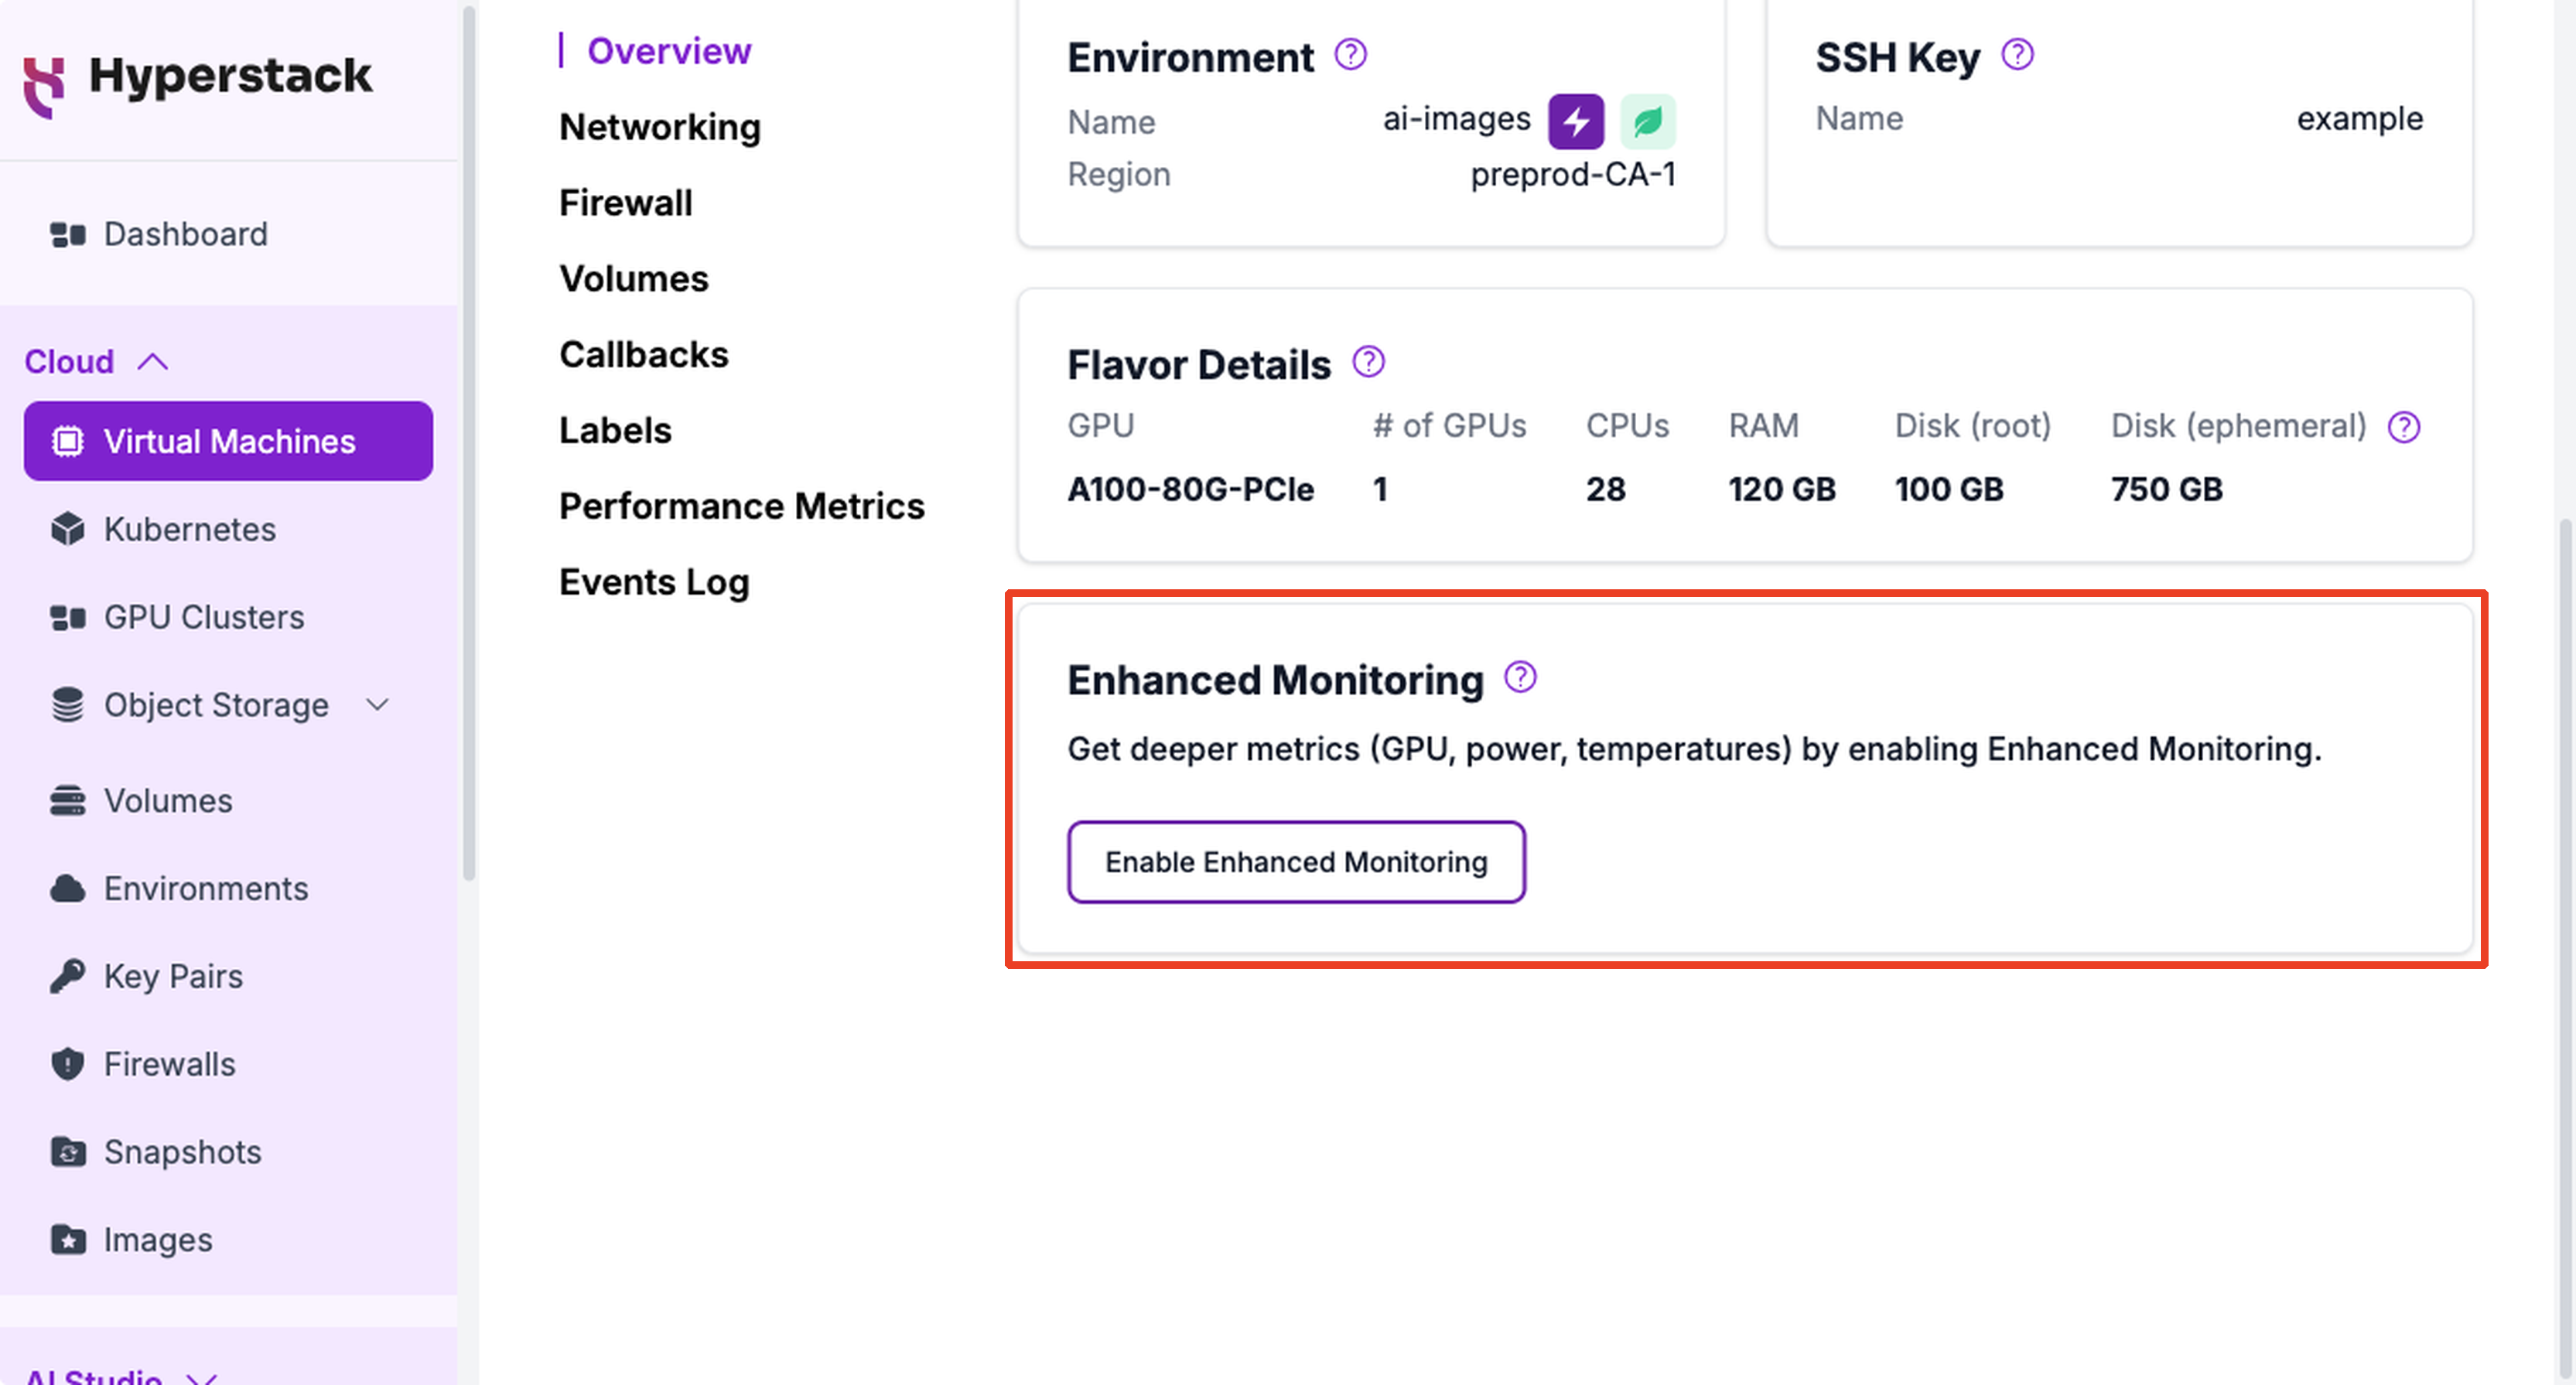
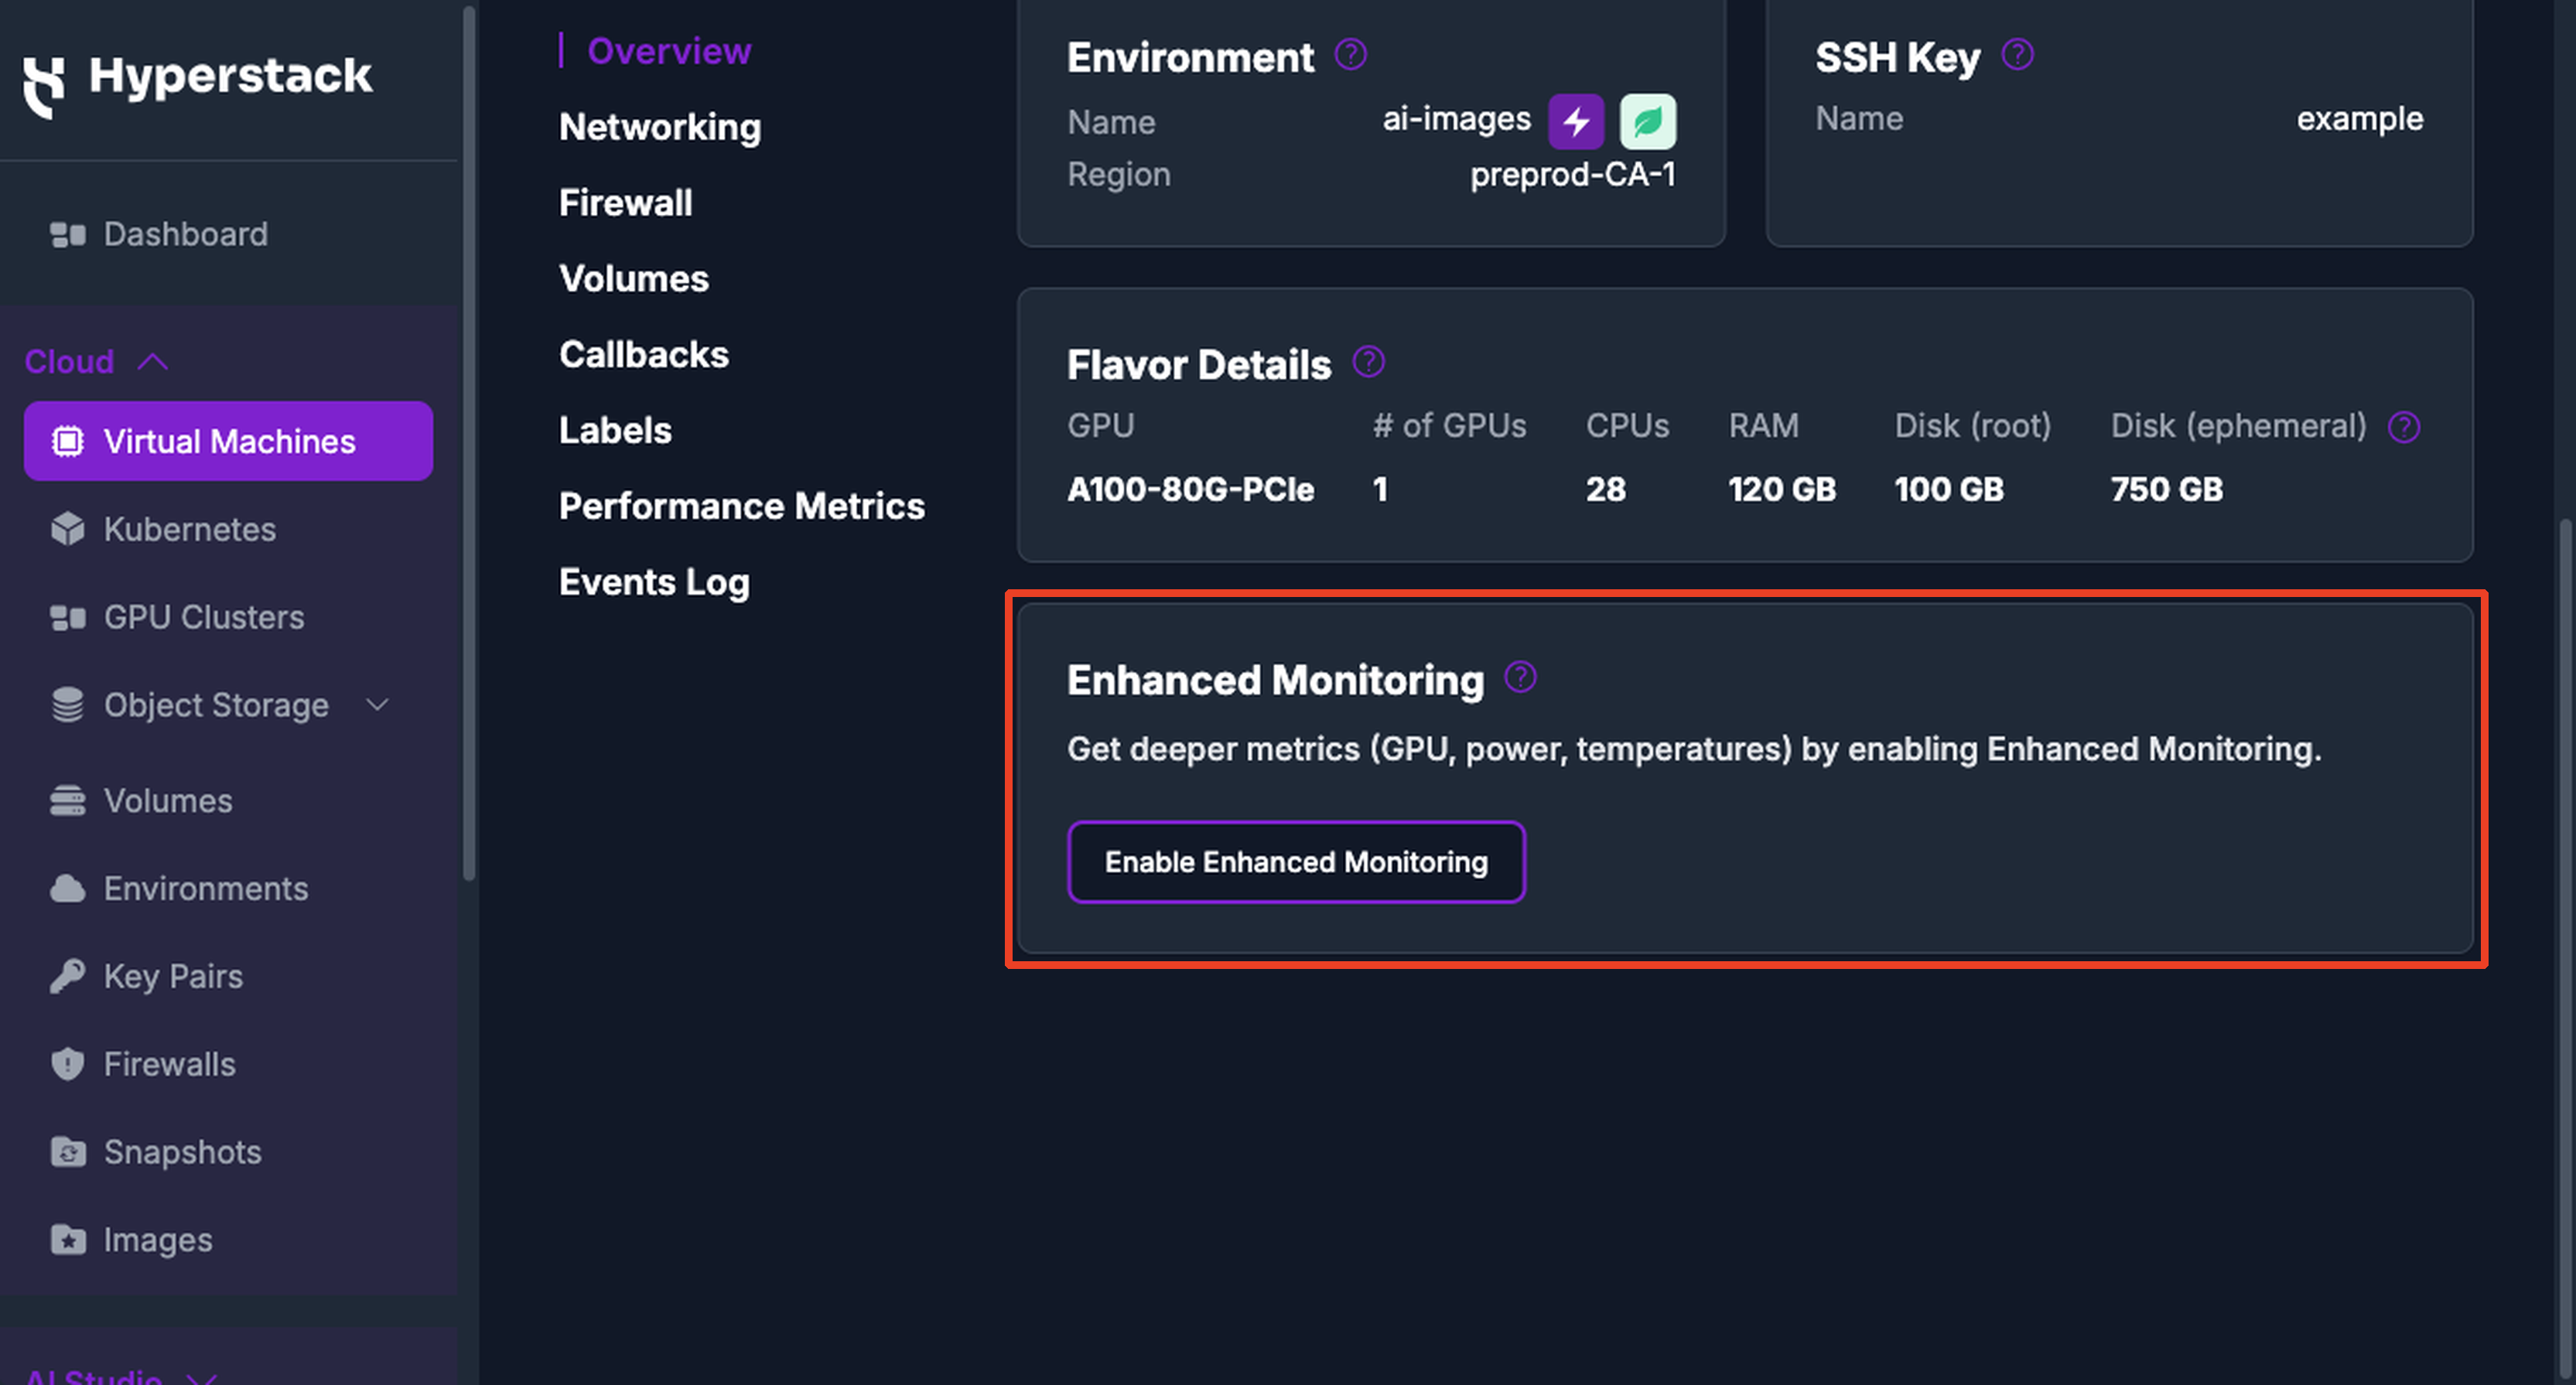
In Hyperstack, navigate to the Virtual Machines page and click the VM you want to change. On the Overview tab, scroll to the Enhanced Monitoring card and click Enable Enhanced Monitoring.
Two other entry points open the same modal: the ⋮ menu at the top right of the VM details page, and the ⋮ menu on the VM's row in the Virtual Machines list. Both are available only to roles that hold the Enhanced Monitoring permission. See User Roles for how permissions are assigned.
-
Select Enhanced mode
The Enhanced Monitoring Setup modal opens with Standard mode selected. Select Enhanced mode and click Save selection.
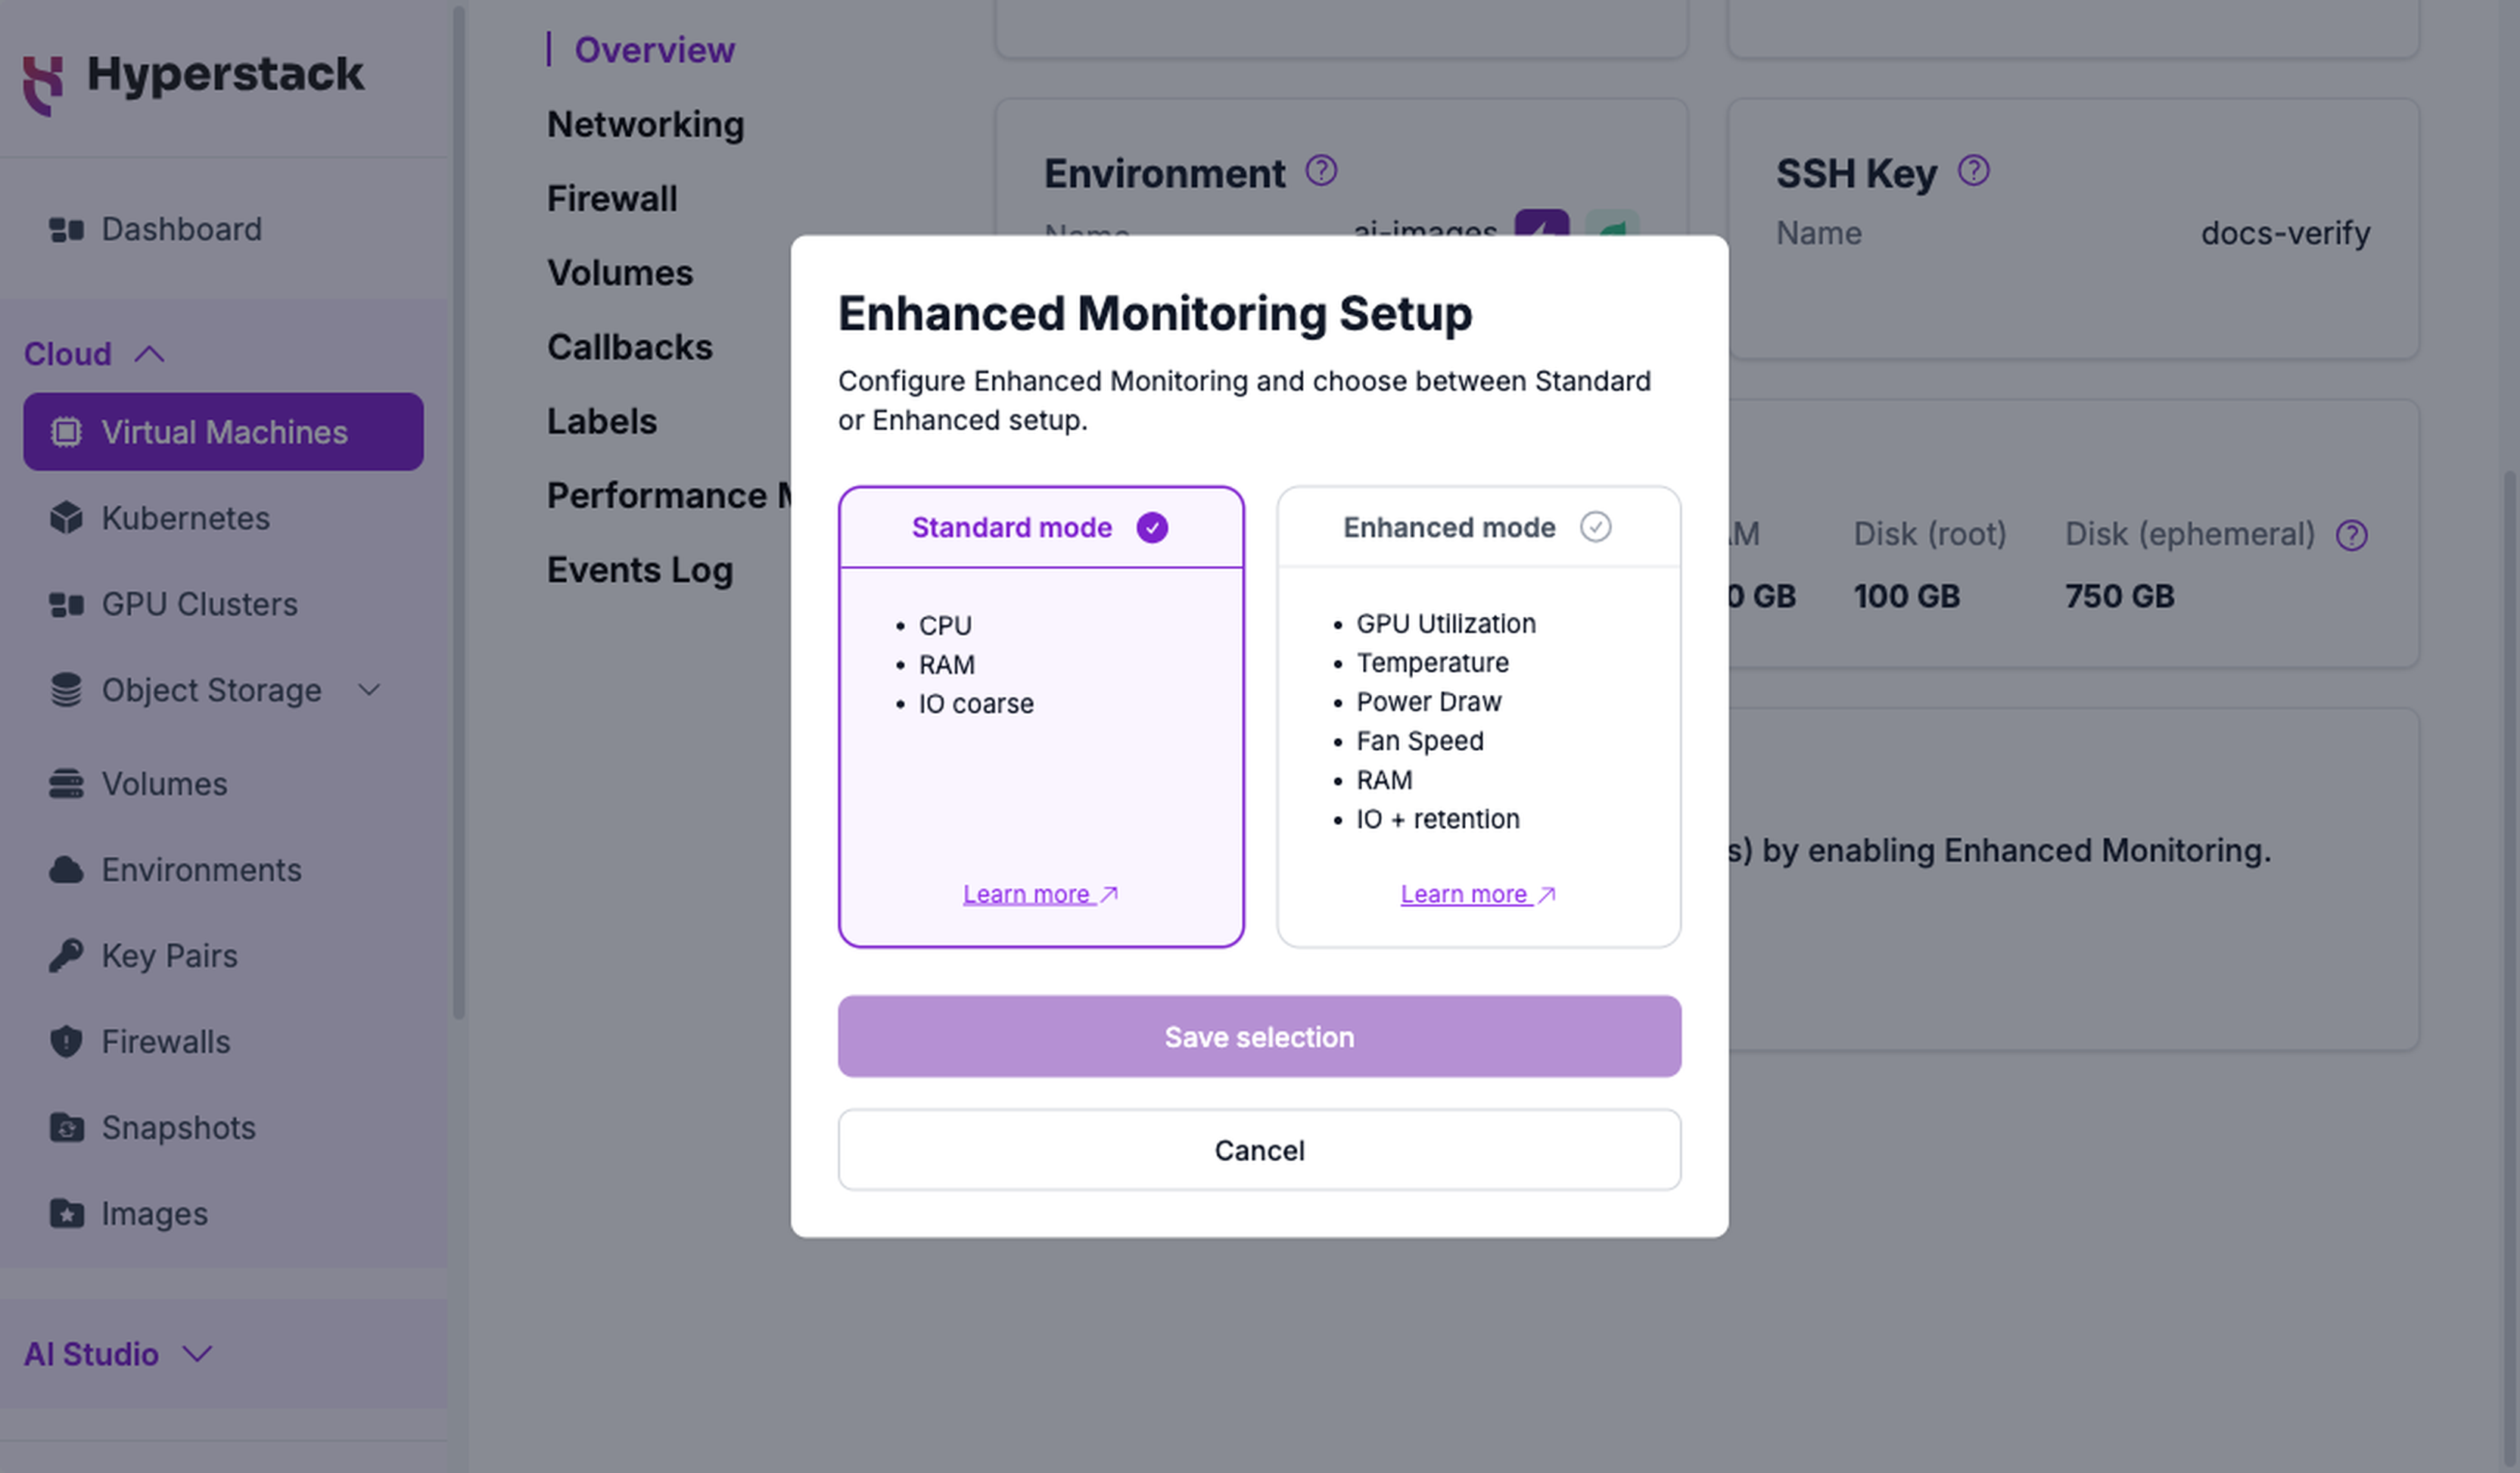
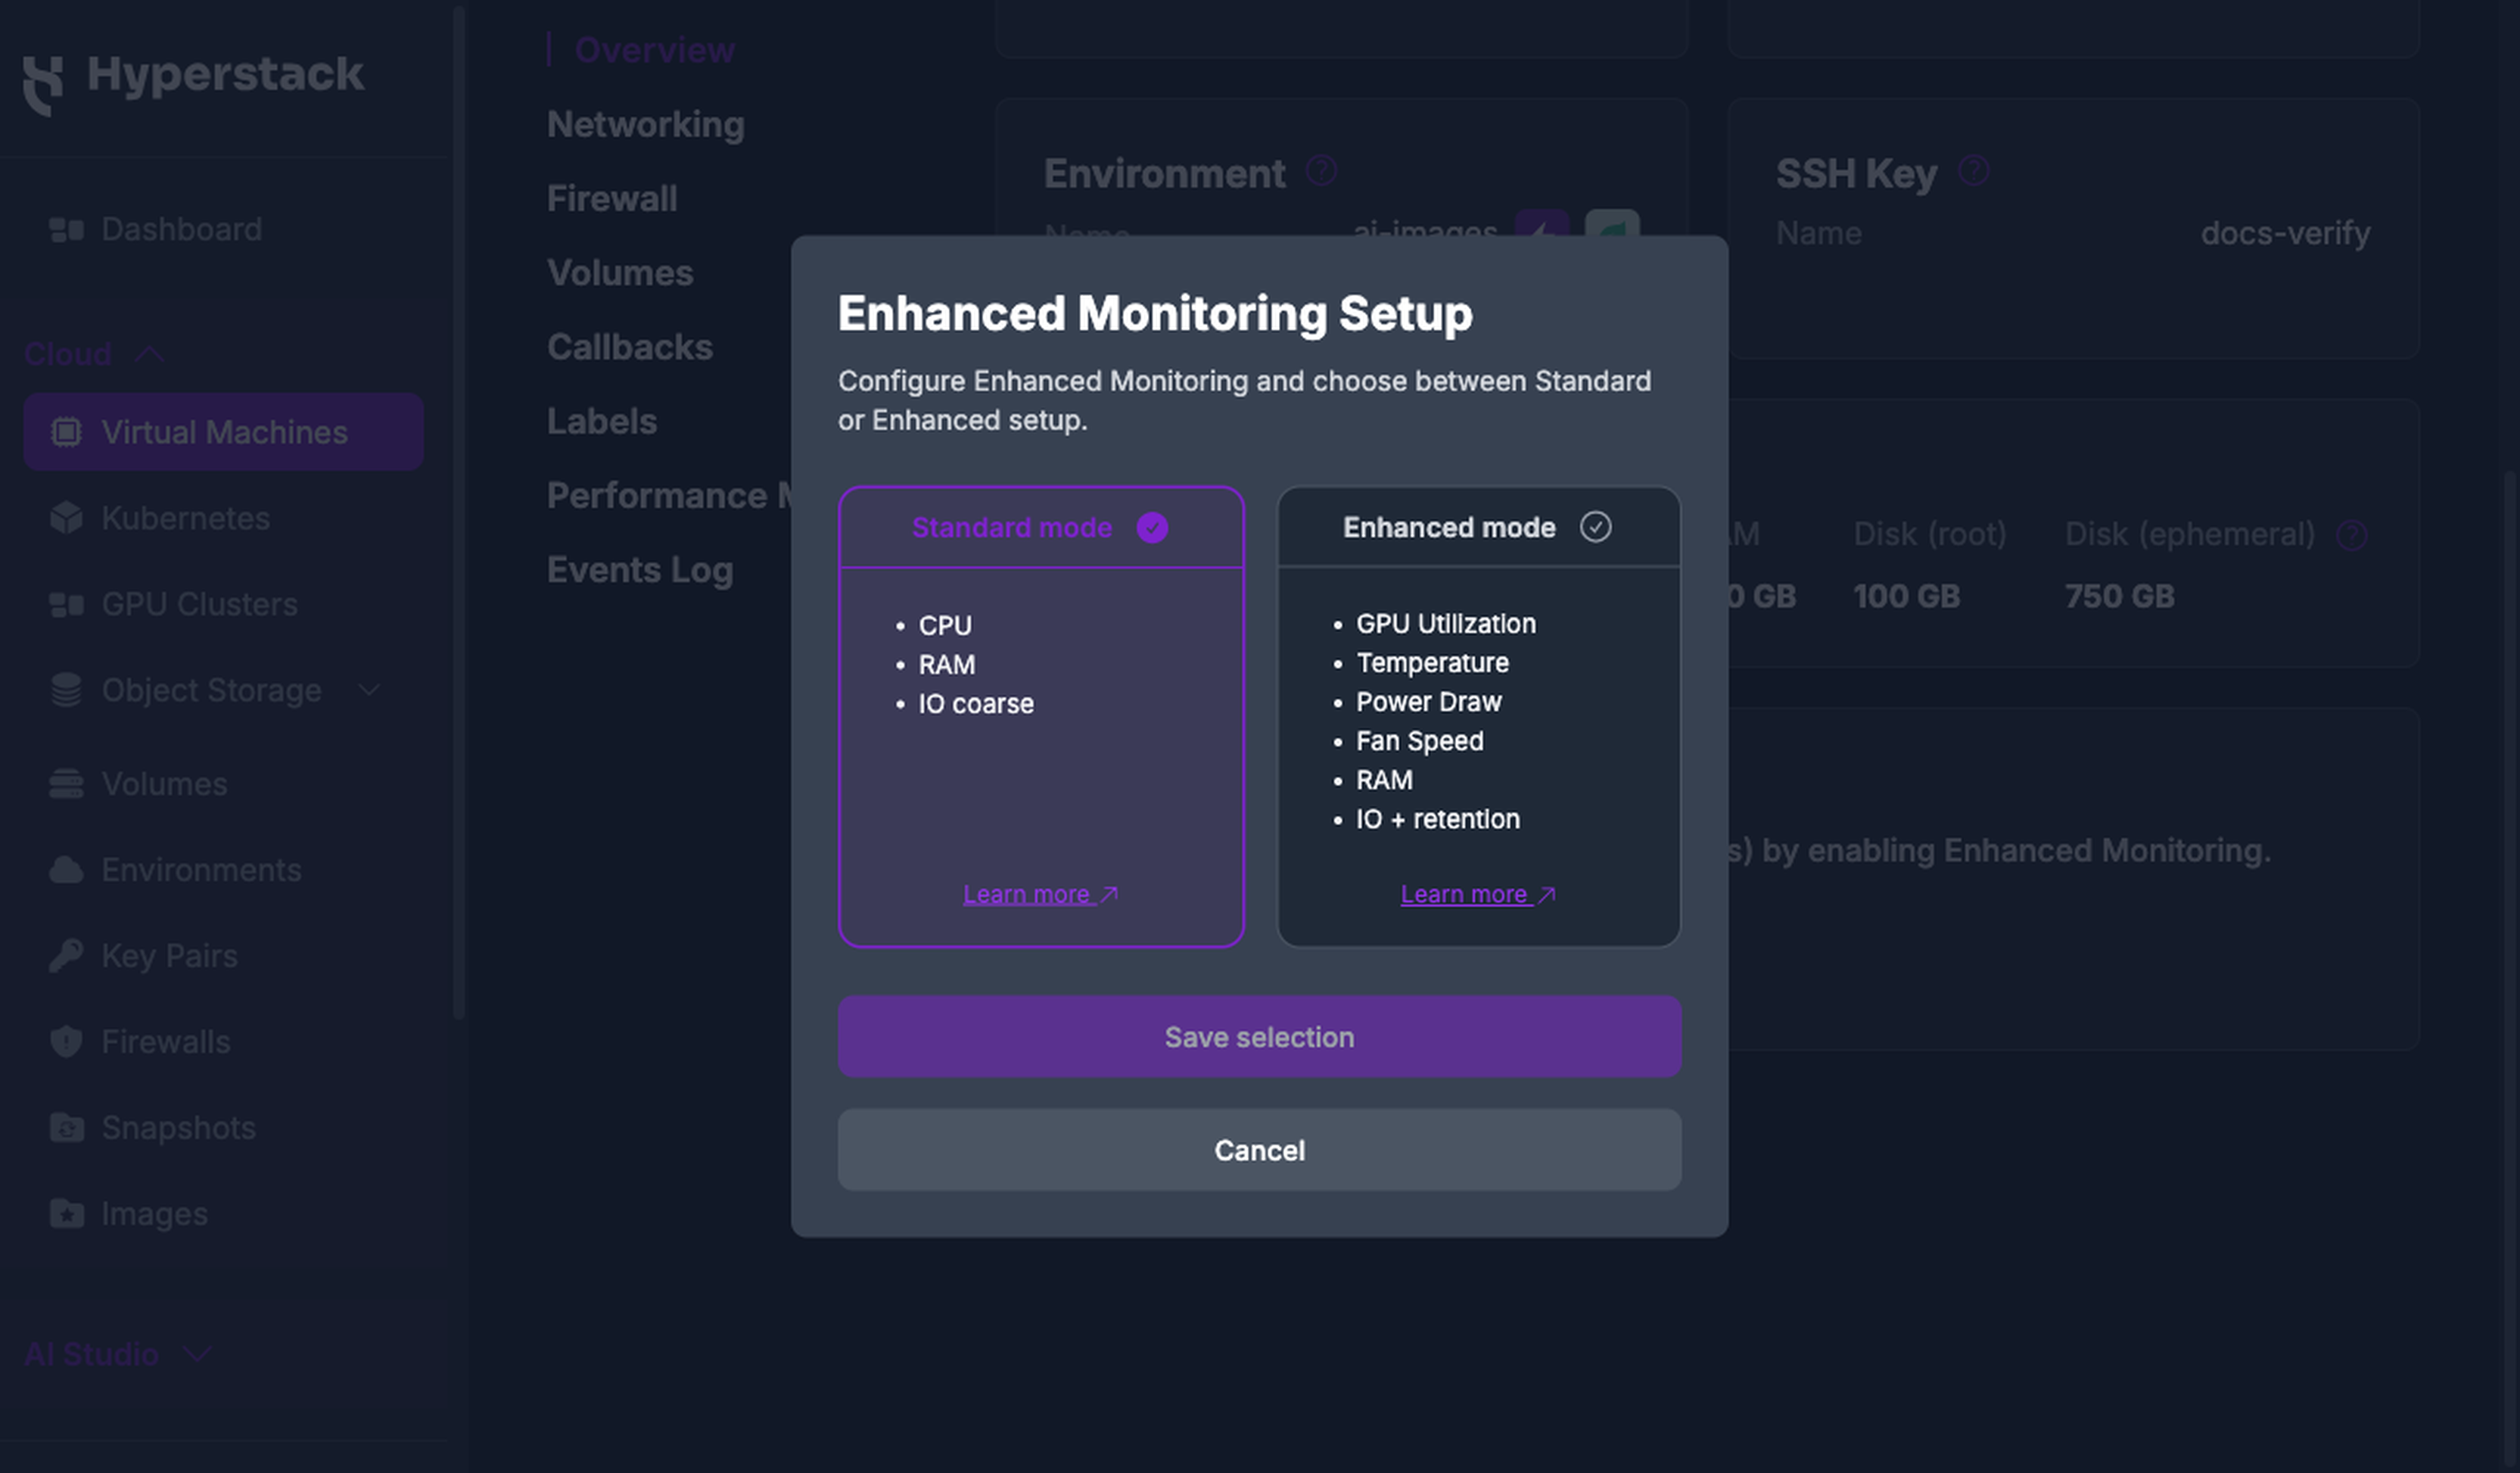
To do the same through the API, call the Update Enhanced Monitoring for a virtual machine endpoint with
{"enabled": true}. The response includes theinstall_commandto run inside the VM. Disabling Enhanced Monitoring returns no command. -
Run the install command
Hyperstack displays a one-line installer command. Click Copy, then SSH into your VM and execute it:
terminalInstall the agentcurl -fsSL "https://observability.hyperstack.cloud/install?runtime=systemd" | sudo bashThe installer adds a
hyperstack-agentservice user, installs the agent under/opt/hyperstack-agent/, and registers and starts ahyperstack-agentsystemd service. Metrics begin arriving shortly after it starts.You can reopen this command at any time from the Enhanced Monitoring card on the VM's Overview tab, by clicking How to Install Enhanced Monitoring?.
Supported DistributionsThe installer supports Linux distributions running systemd. The command elevates itself with
sudo, so the account you connect with needs sudo privileges. The VM needscurland outbound HTTPS access to the metrics gateway.
Enhanced Monitoring card states
The Enhanced Monitoring card on the Overview tab reflects the current state of the VM:
| State | What the card shows |
|---|---|
| Standard mode | The prompt Get deeper metrics (GPU, power, temperatures) by enabling Enhanced Monitoring and an Enable Enhanced Monitoring button |
| Enhanced mode, agent not yet reporting | Last Check-in reading Awaiting first ping, with Version, Exporters, and Collection Status empty, plus a How to Install Enhanced Monitoring? button |
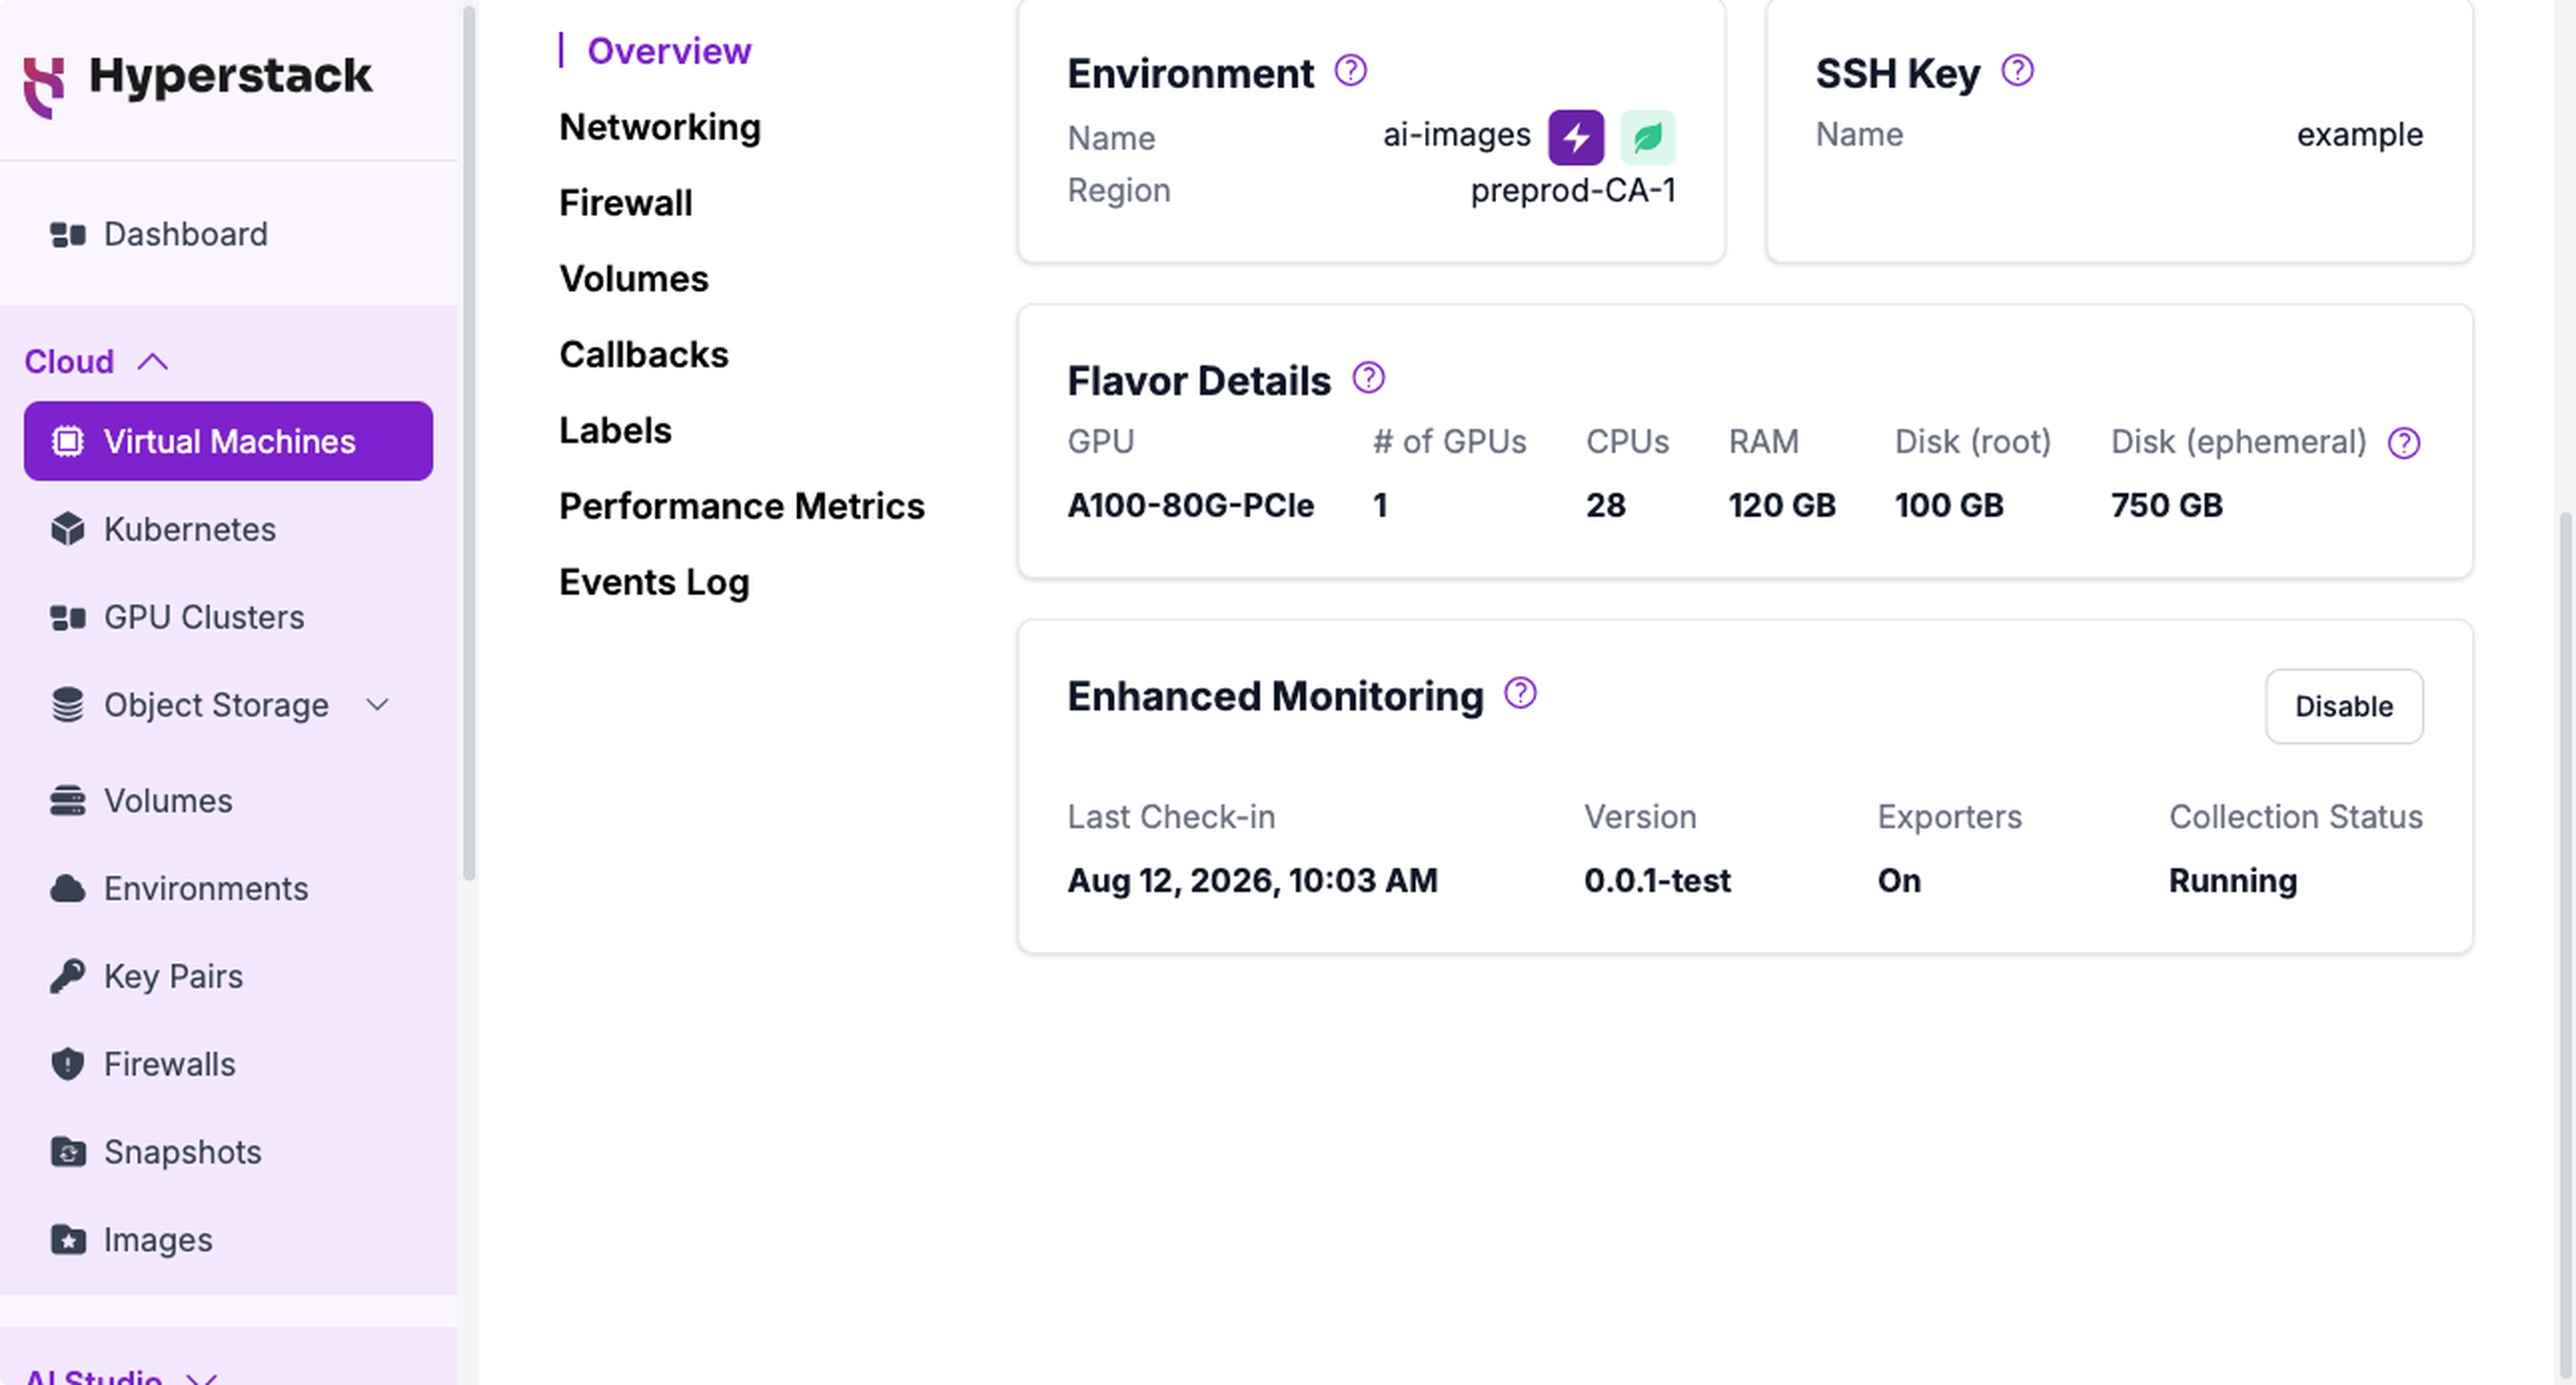
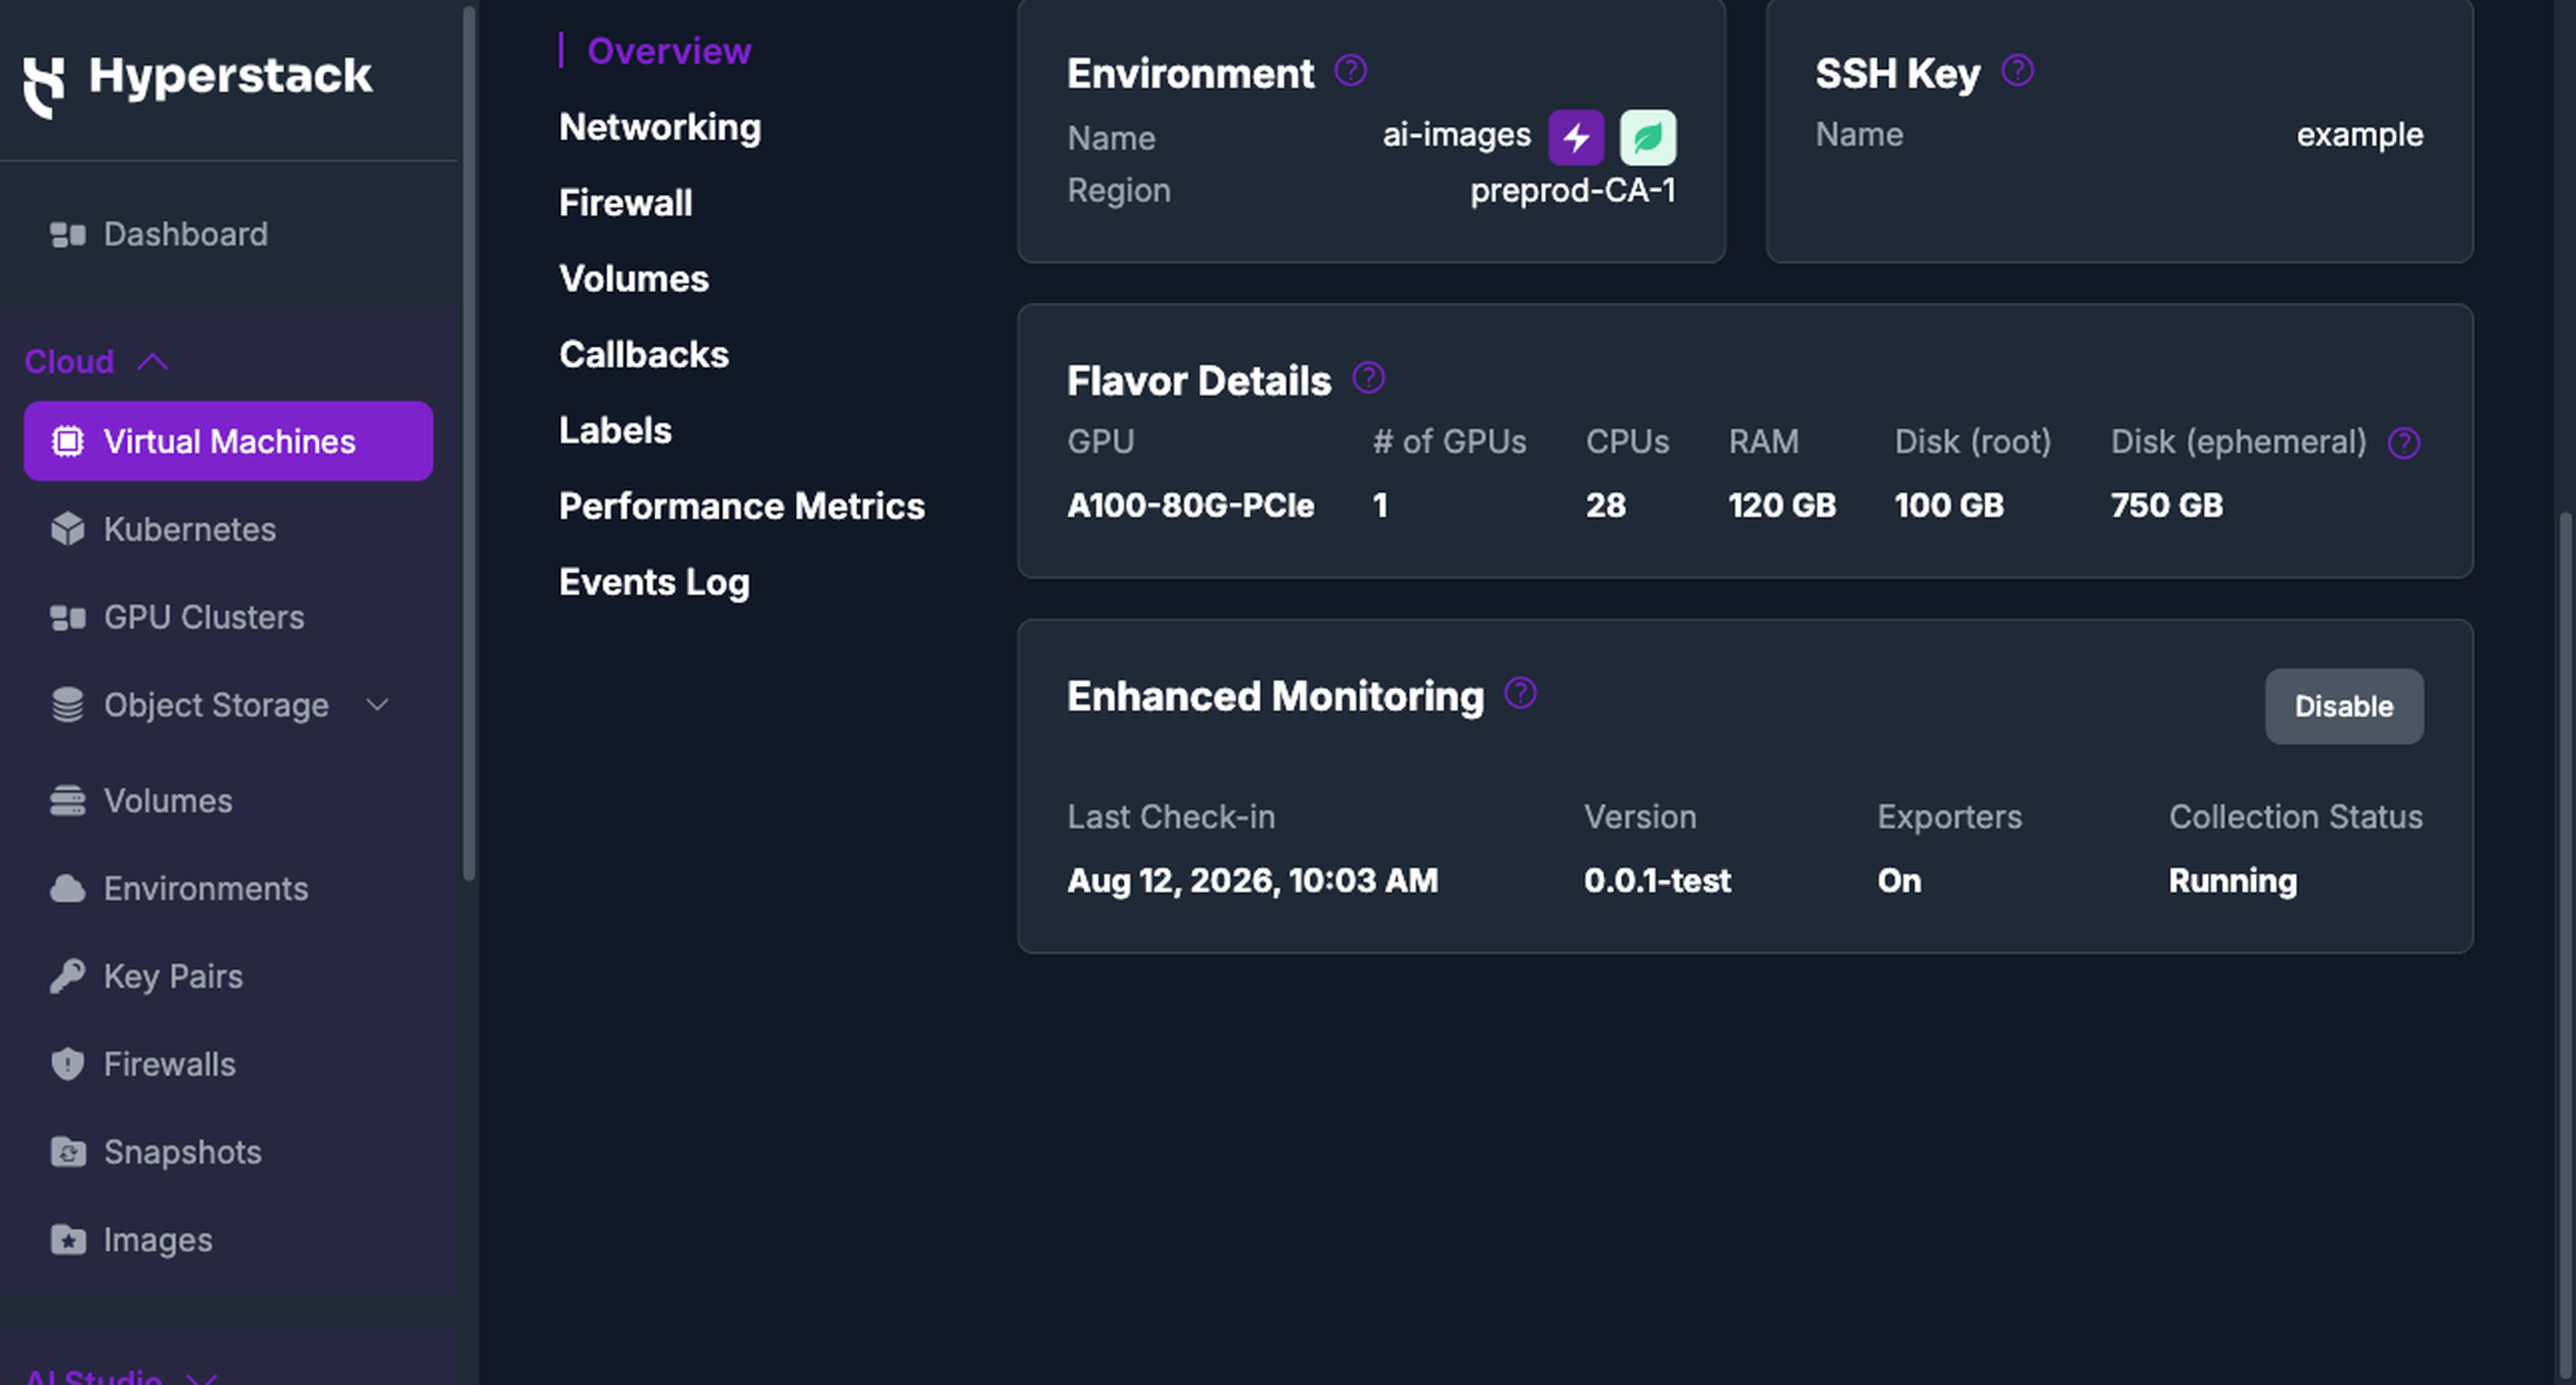
| Enhanced mode, agent reporting | Last Check-in with the time of the most recent ping, and the agent Version, active Exporters, and Collection Status populated |
In Enhanced mode the card header also carries a Disable button, which returns the VM to Standard mode.
View Enhanced Metrics in Hyperstack
Once the agent is reporting, the Performance Metrics tab on the VM shows the additional data it collects.
-
Navigate to the VM
In Hyperstack, navigate to the Virtual Machines page and click the VM you want to inspect.
-
Open Performance Metrics
In the VM details menu, click Performance Metrics. With the agent reporting, an Enhanced Monitoring panel at the top of the page summarises agent health:
- Last Check-in, the agent heartbeat, showing the time of the most recent ping
- Uptime, measured since the last boot
- Data Reliability, the percentage of samples delivered successfully
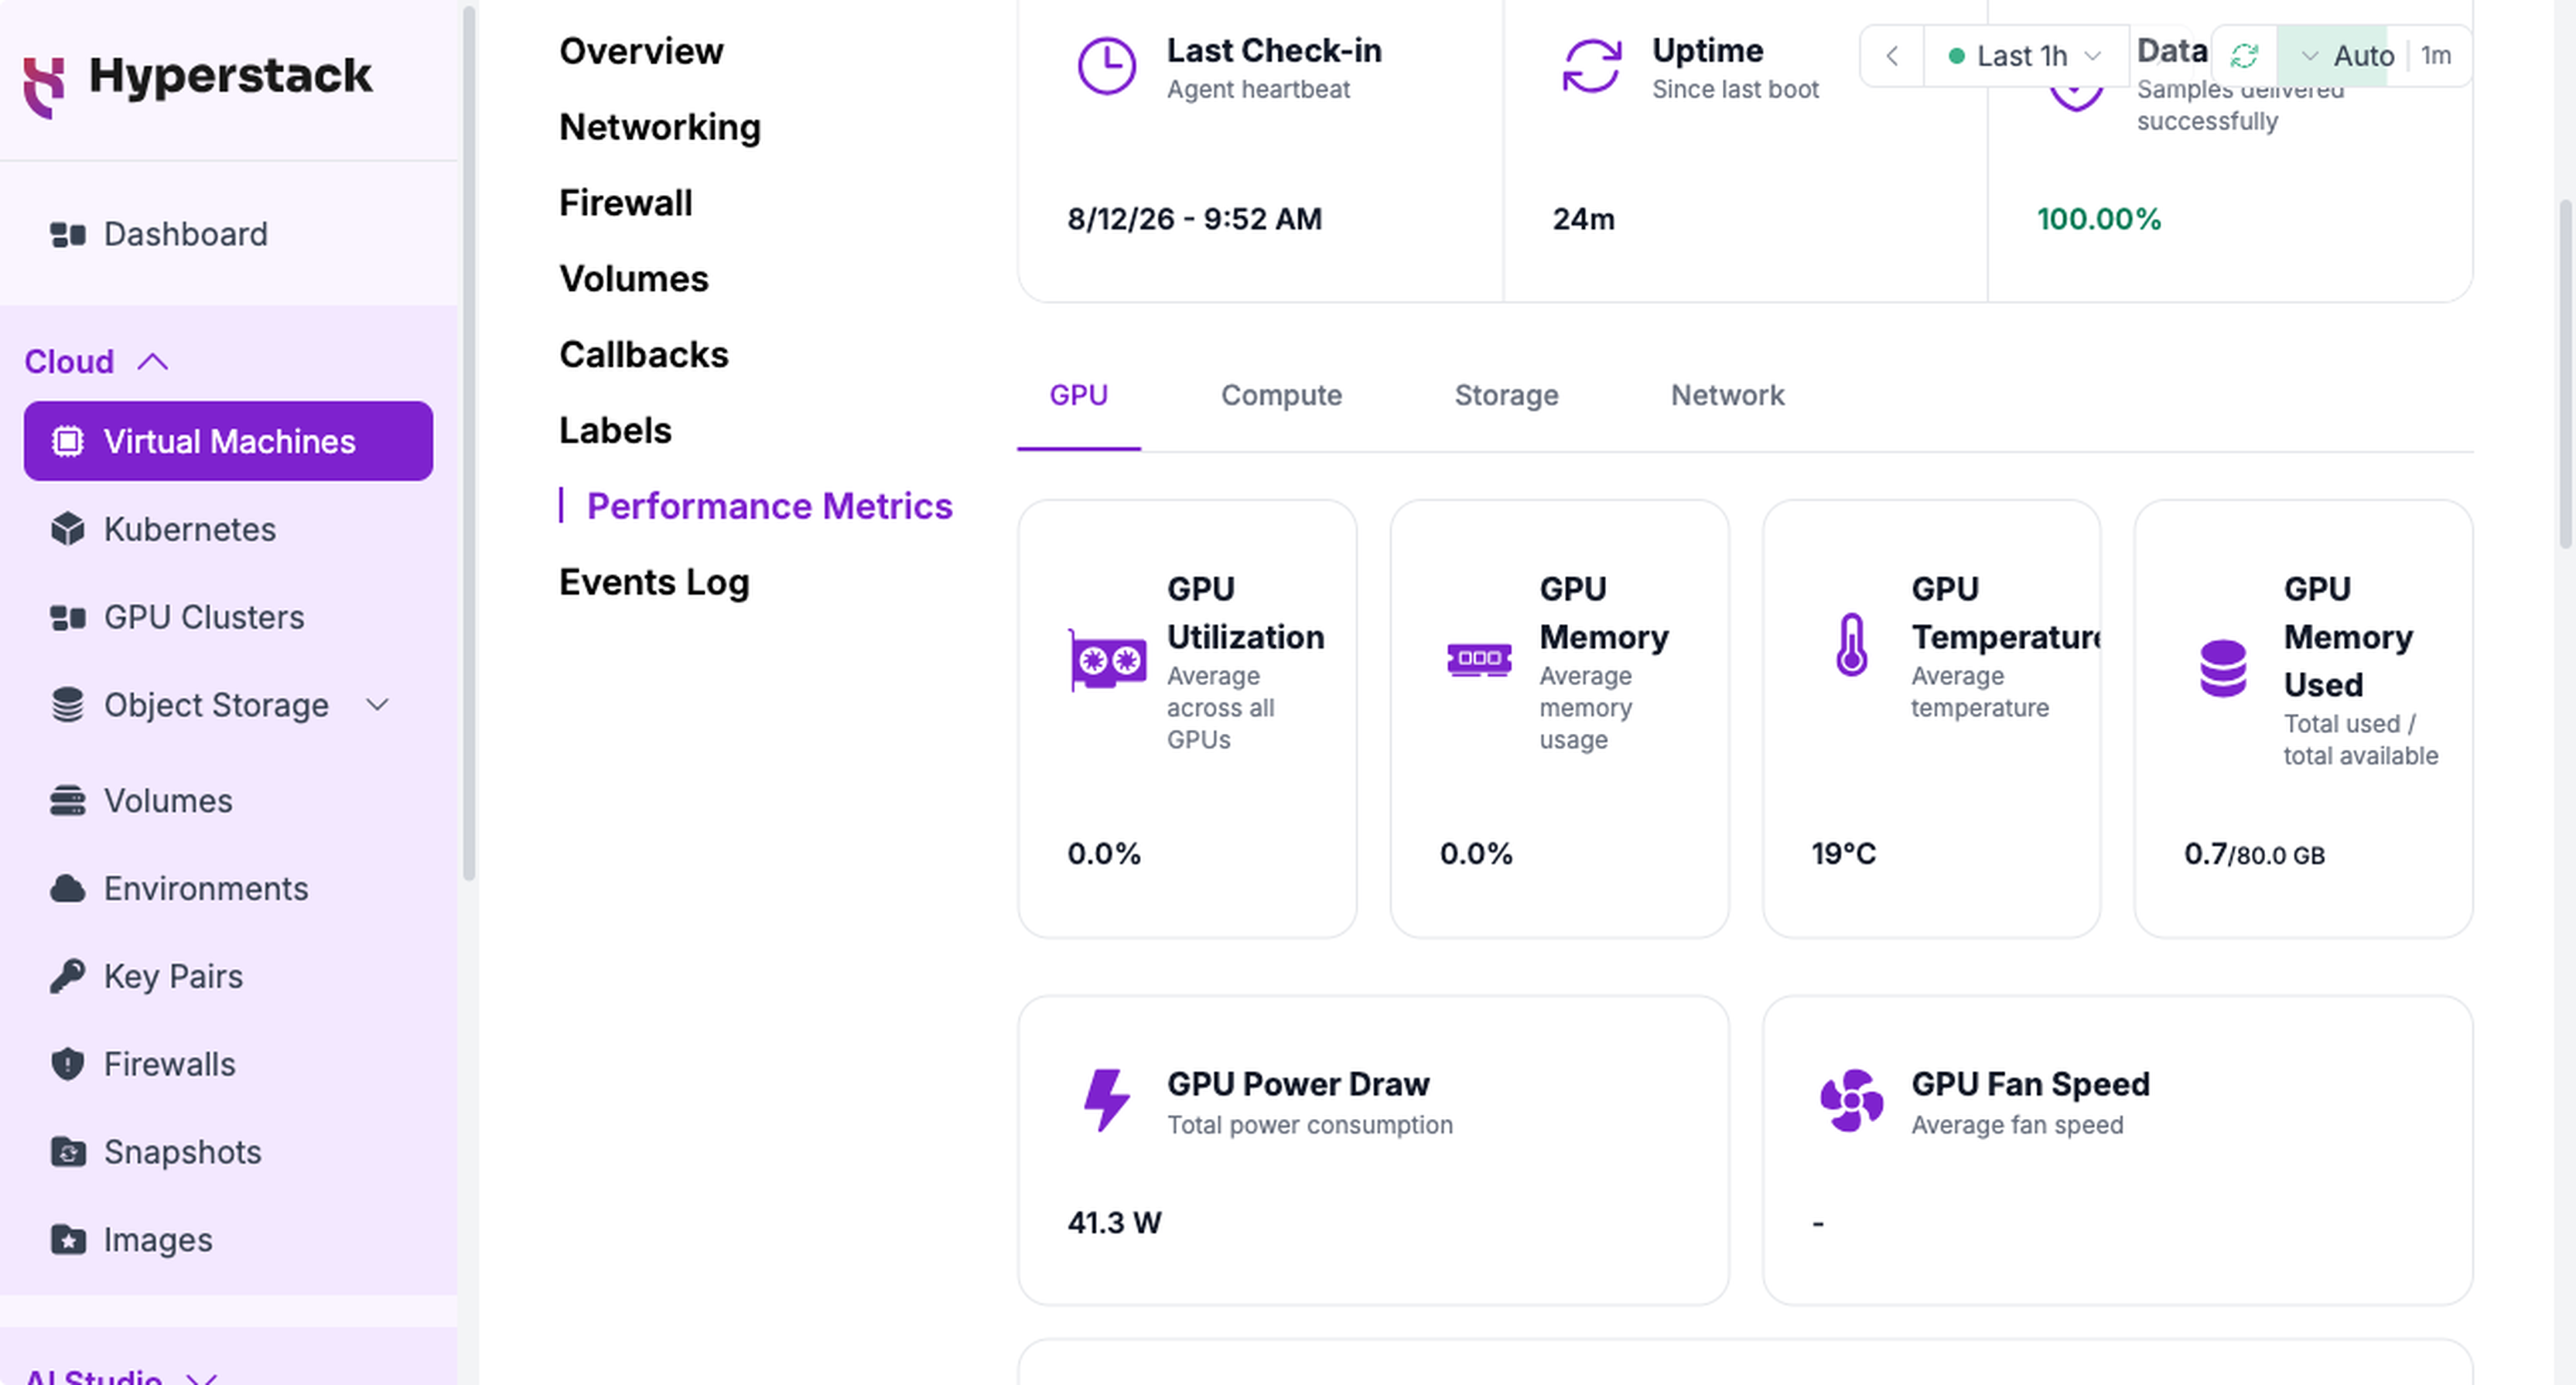
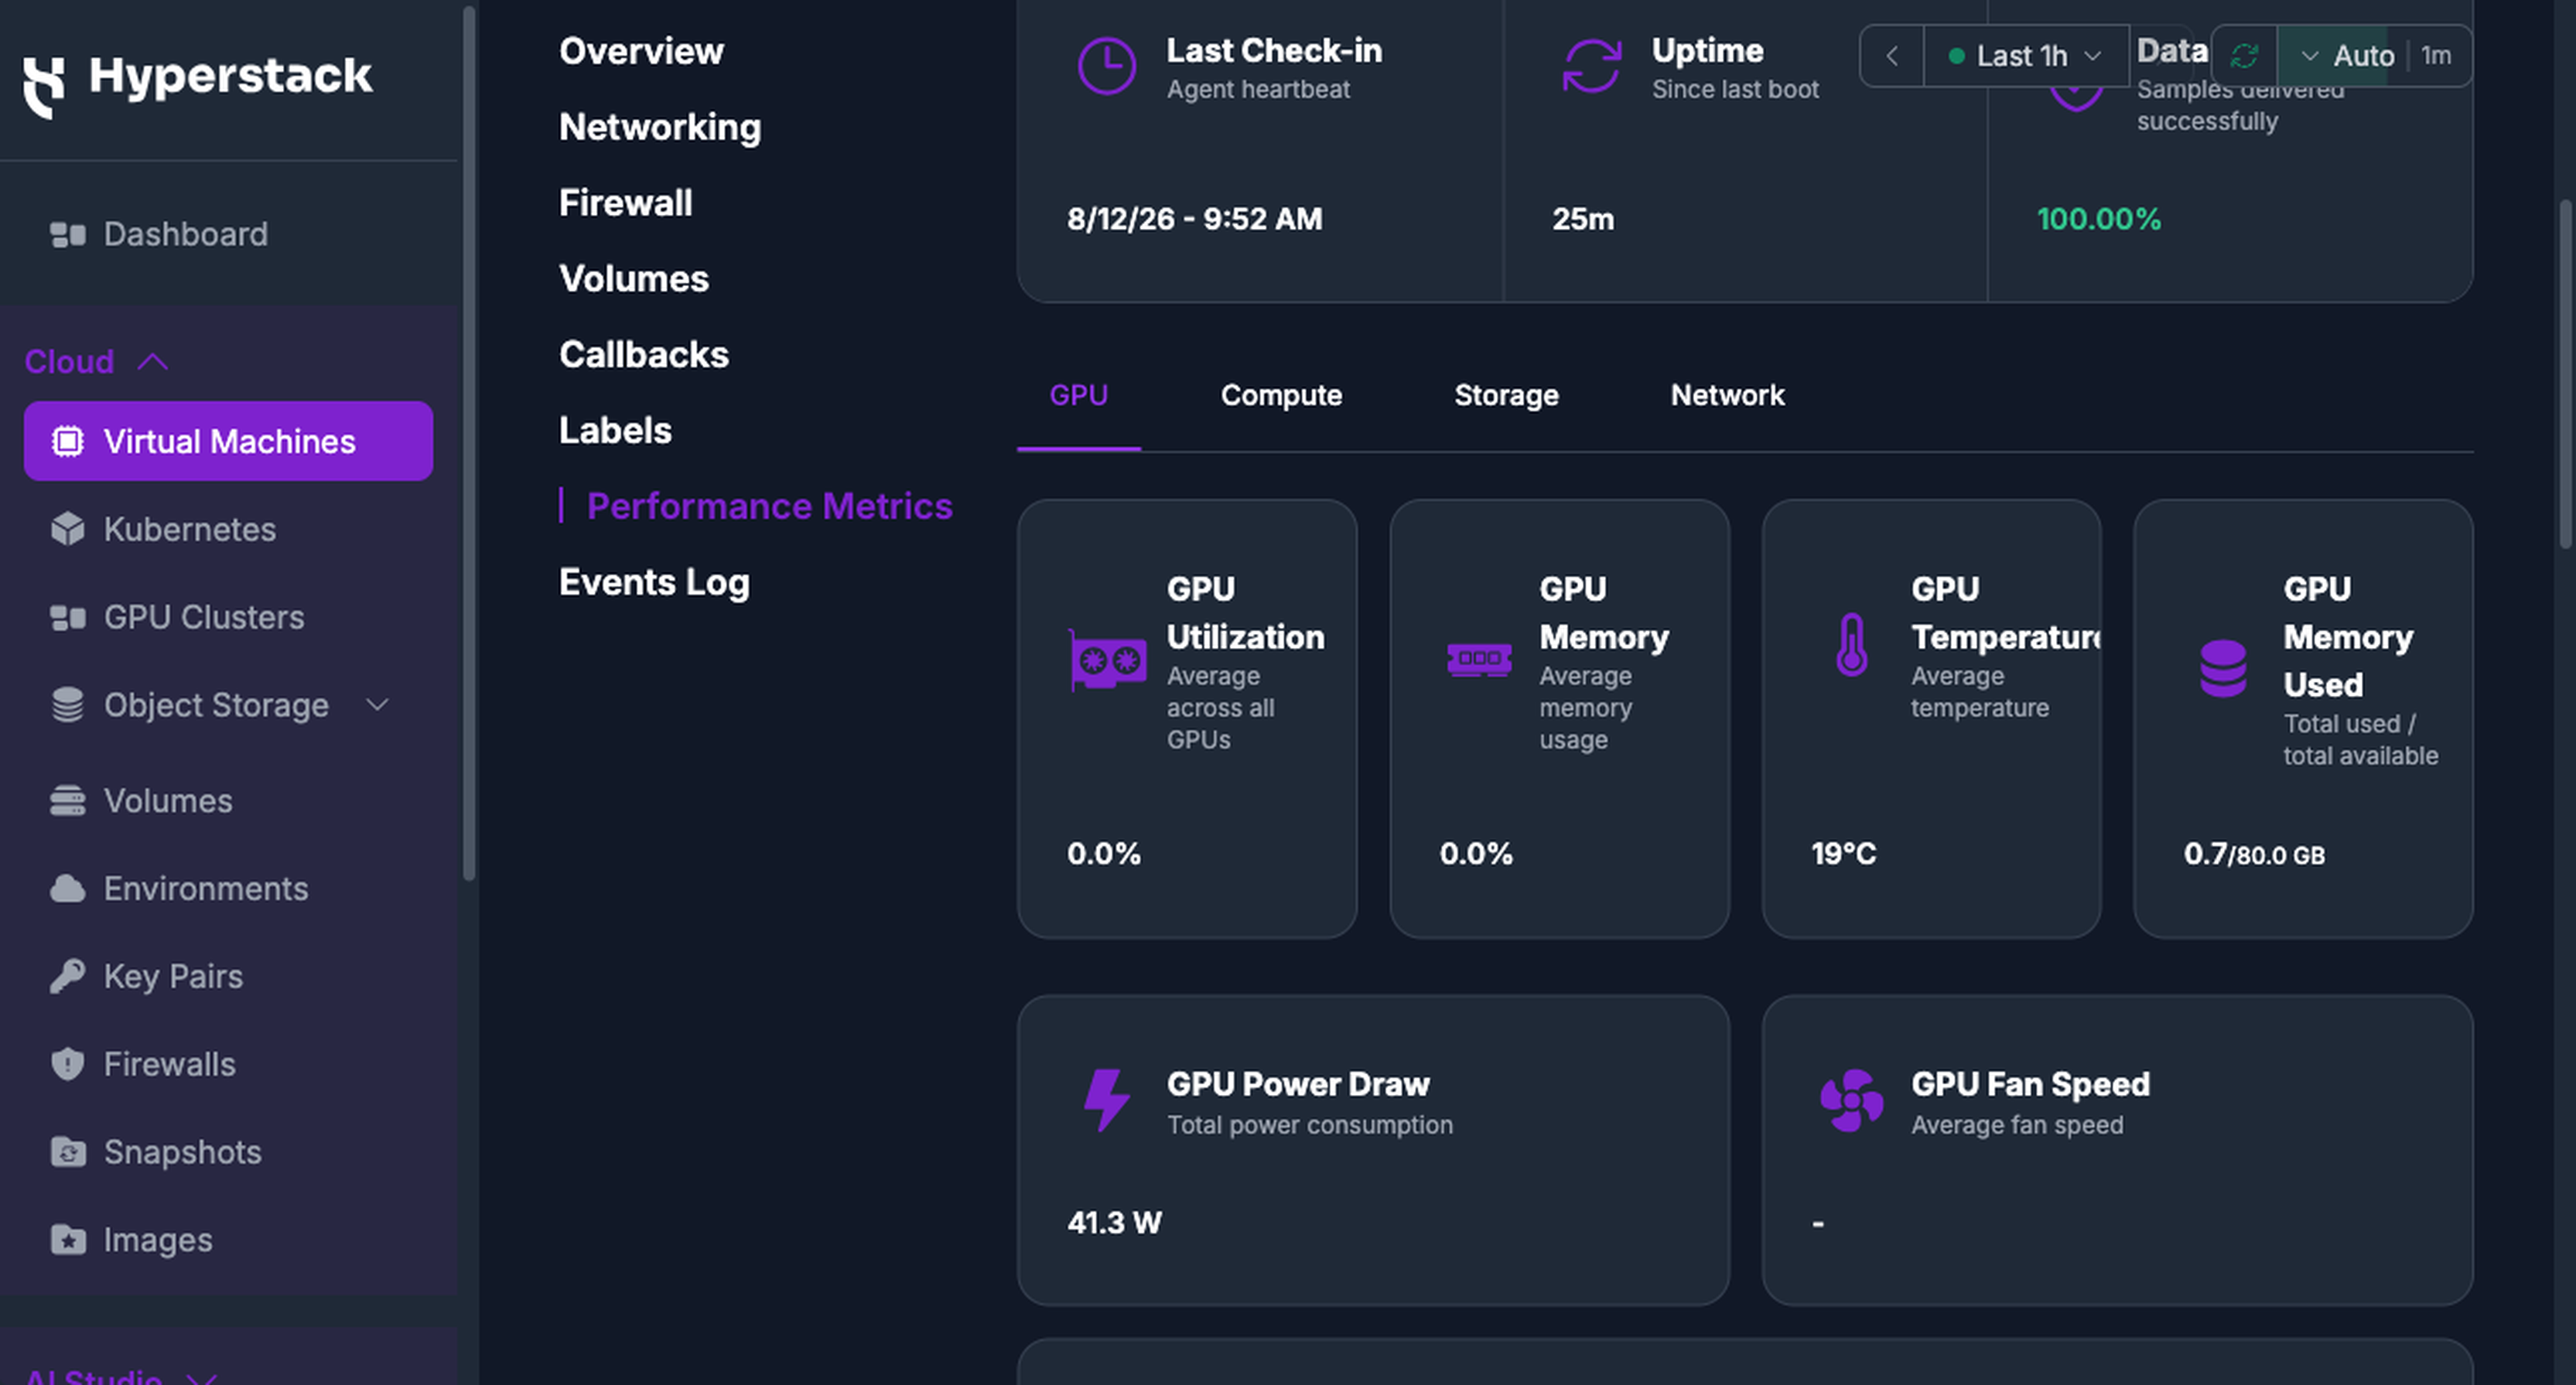
Below the panel, sub-tabs cover the system: Compute, Storage, and Network, plus GPU and Dedicated Inference where the VM qualifies for them.
The GPU sub-tab appears on any VM whose flavor includes a GPU. It summarises GPU Utilization, GPU Memory, GPU Temperature, GPU Memory Used, GPU Power Draw, and GPU Fan Speed, each averaged or totalled across the GPUs on the VM, followed by time-series charts. A GPU VM without the NVIDIA driver shows the sub-tab with no data in it.
Compute shows CPU Utilization, System load, and RAM Used/Total, with charts for system load, CPU breakdown, and memory usage. Storage and Network cover disk and network activity over the same period.
Time Range and Sample IntervalThe picker at the top right sets the period the charts cover, up to the 90 day maximum lookback. The sample interval next to it drives both the resolution of the charts and how often the page refetches: select 5m and points are plotted 5 minutes apart and the data refreshes every 5 minutes. Auto resolves to a suitable interval for the period you picked and shows the resolved value. Refreshing manually also restarts the time window.
Per-VM ViewThe Hyperstack Performance Metrics page shows data for one VM at a time. To compare or aggregate metrics across multiple VMs, use the Grafana integration or query the Prometheus-compatible API directly.
A virtual machine in Standard mode shows the message You are viewing basic metrics (low granularity) on this tab, with the standard Performance Metrics charts.
Read Inference Metrics on a Dedicated Inference Machine
A virtual machine that serves a dedicated inference endpoint reports what the serving engine is doing, so you can see request load, throughput, and latency instead of inferring them from GPU utilization. Enhanced Monitoring is already on for these machines, so there is nothing to enable and no install command to run.
On the VM's Performance Metrics tab, click the Dedicated Inference sub-tab. The VM also has its own Dedicated Inference page in the left menu, which carries the endpoint details rather than its metrics.
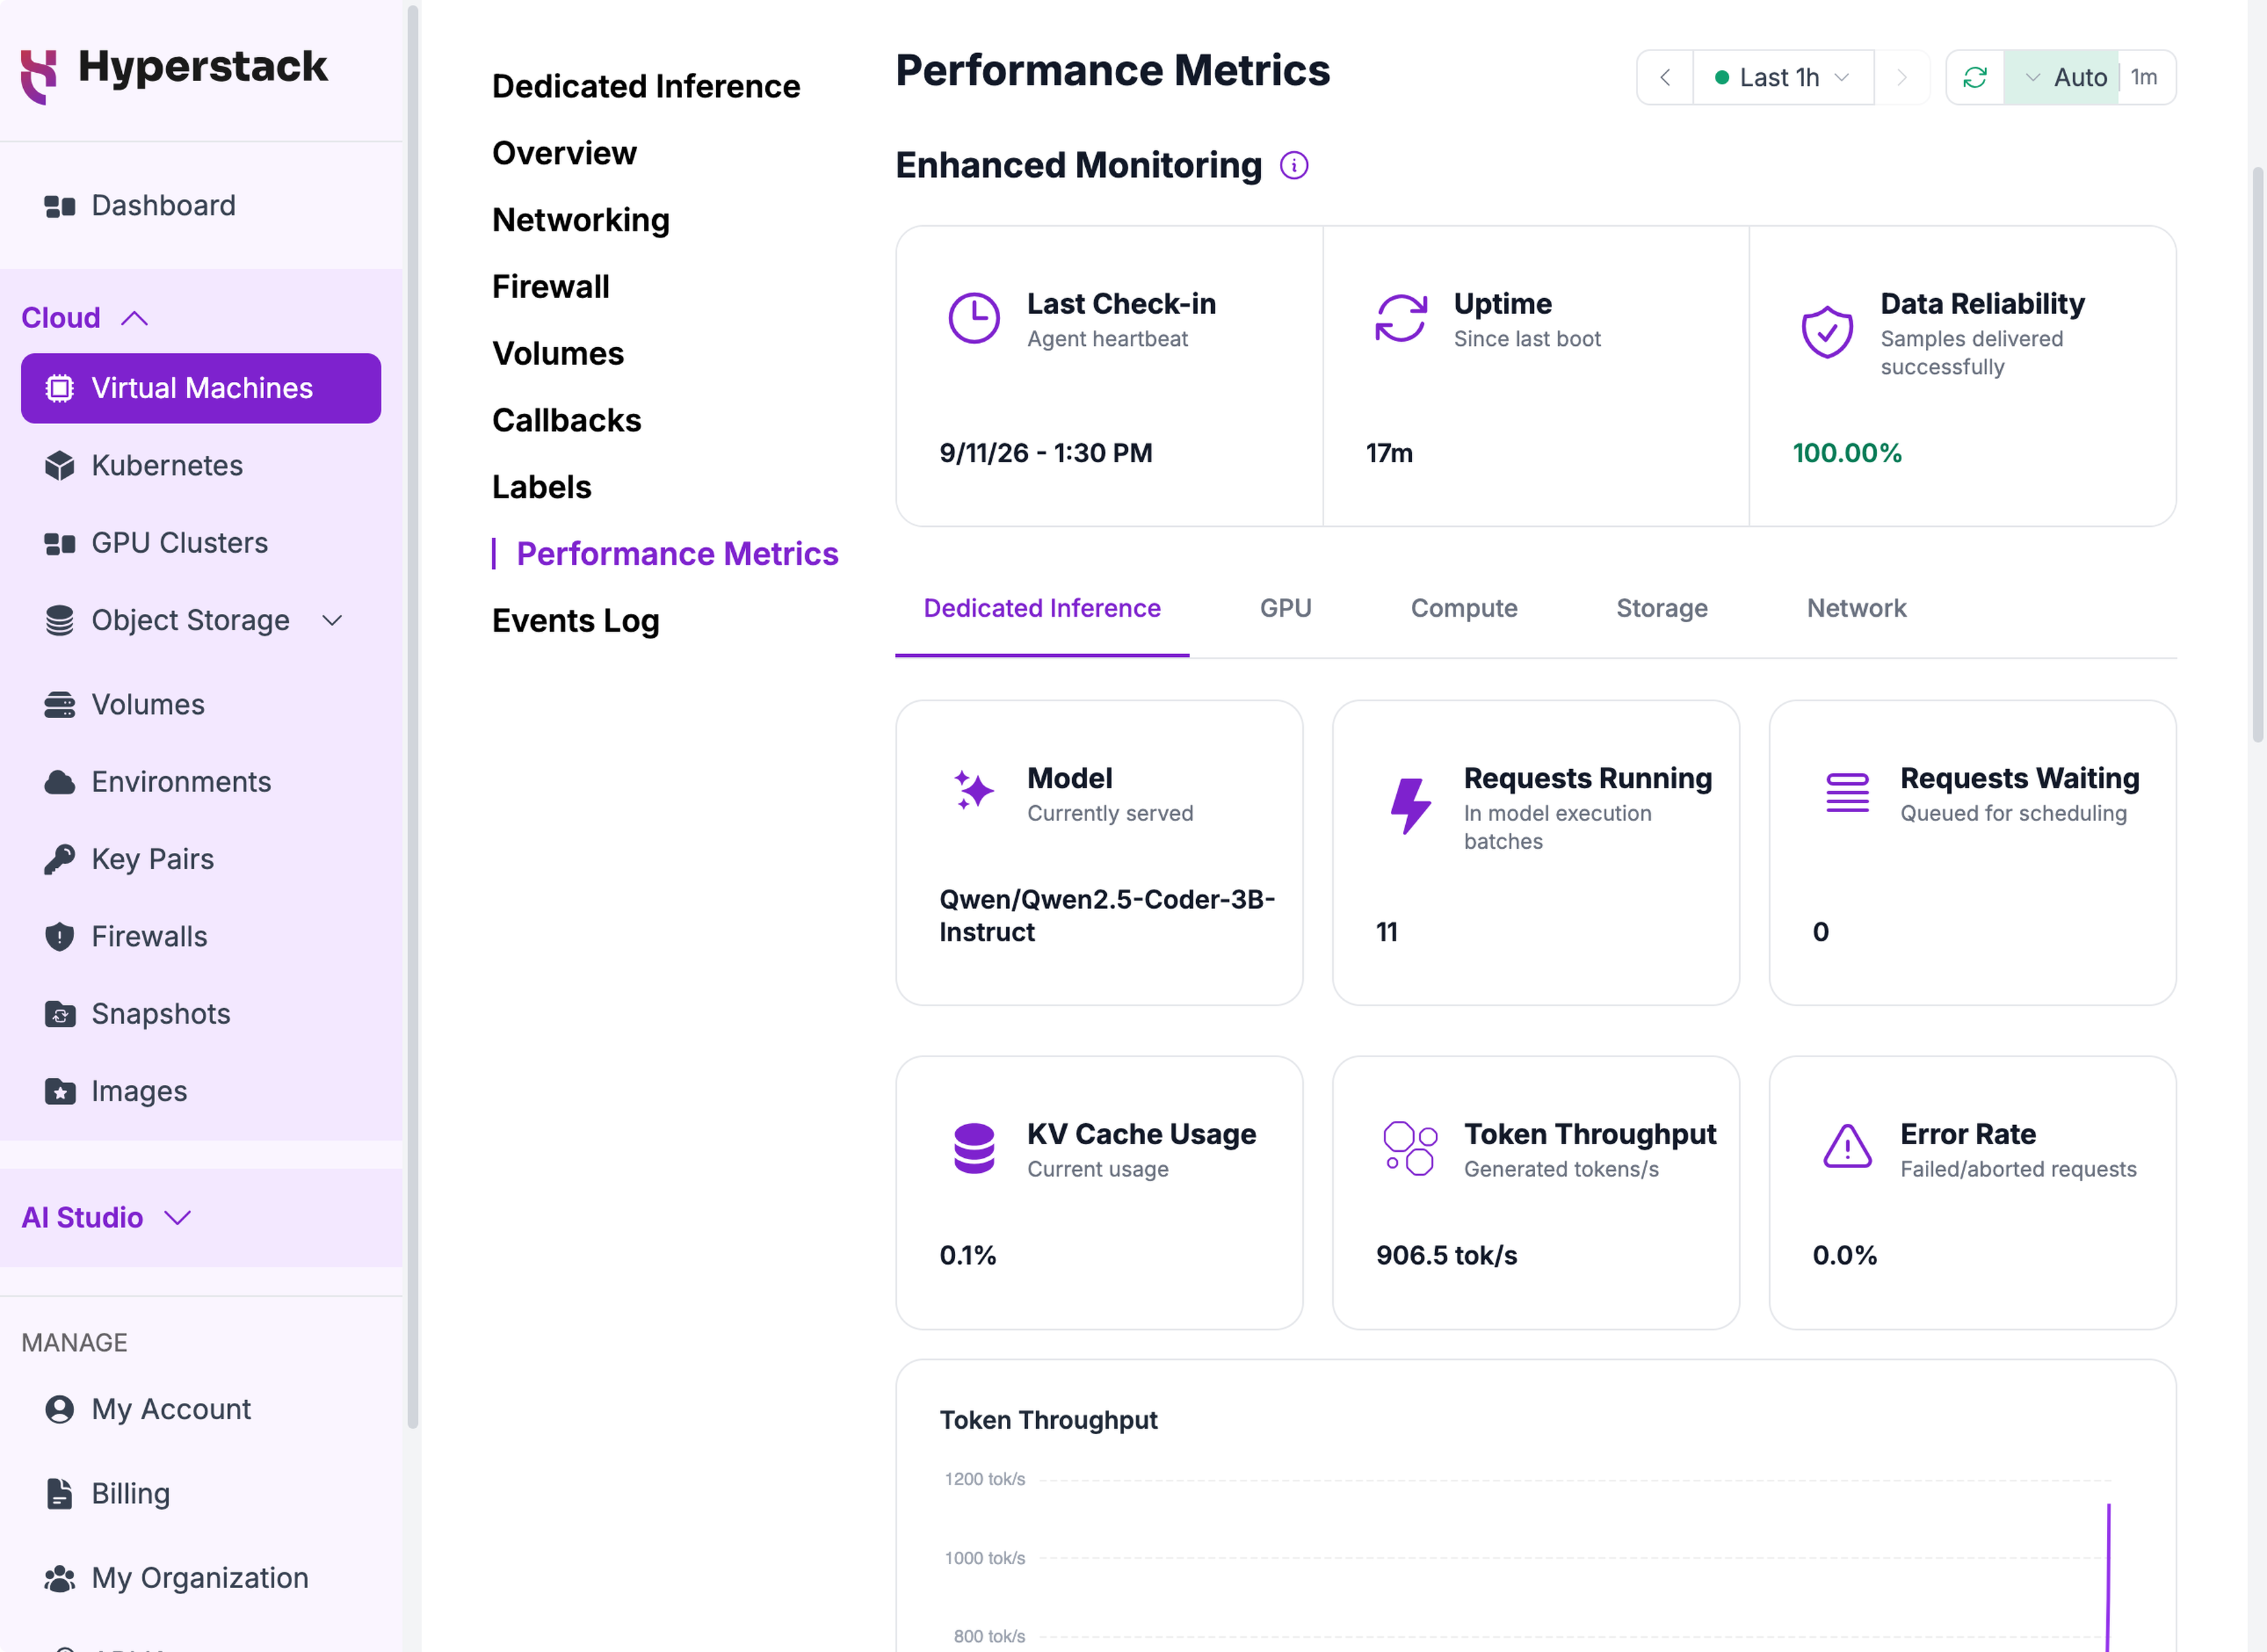
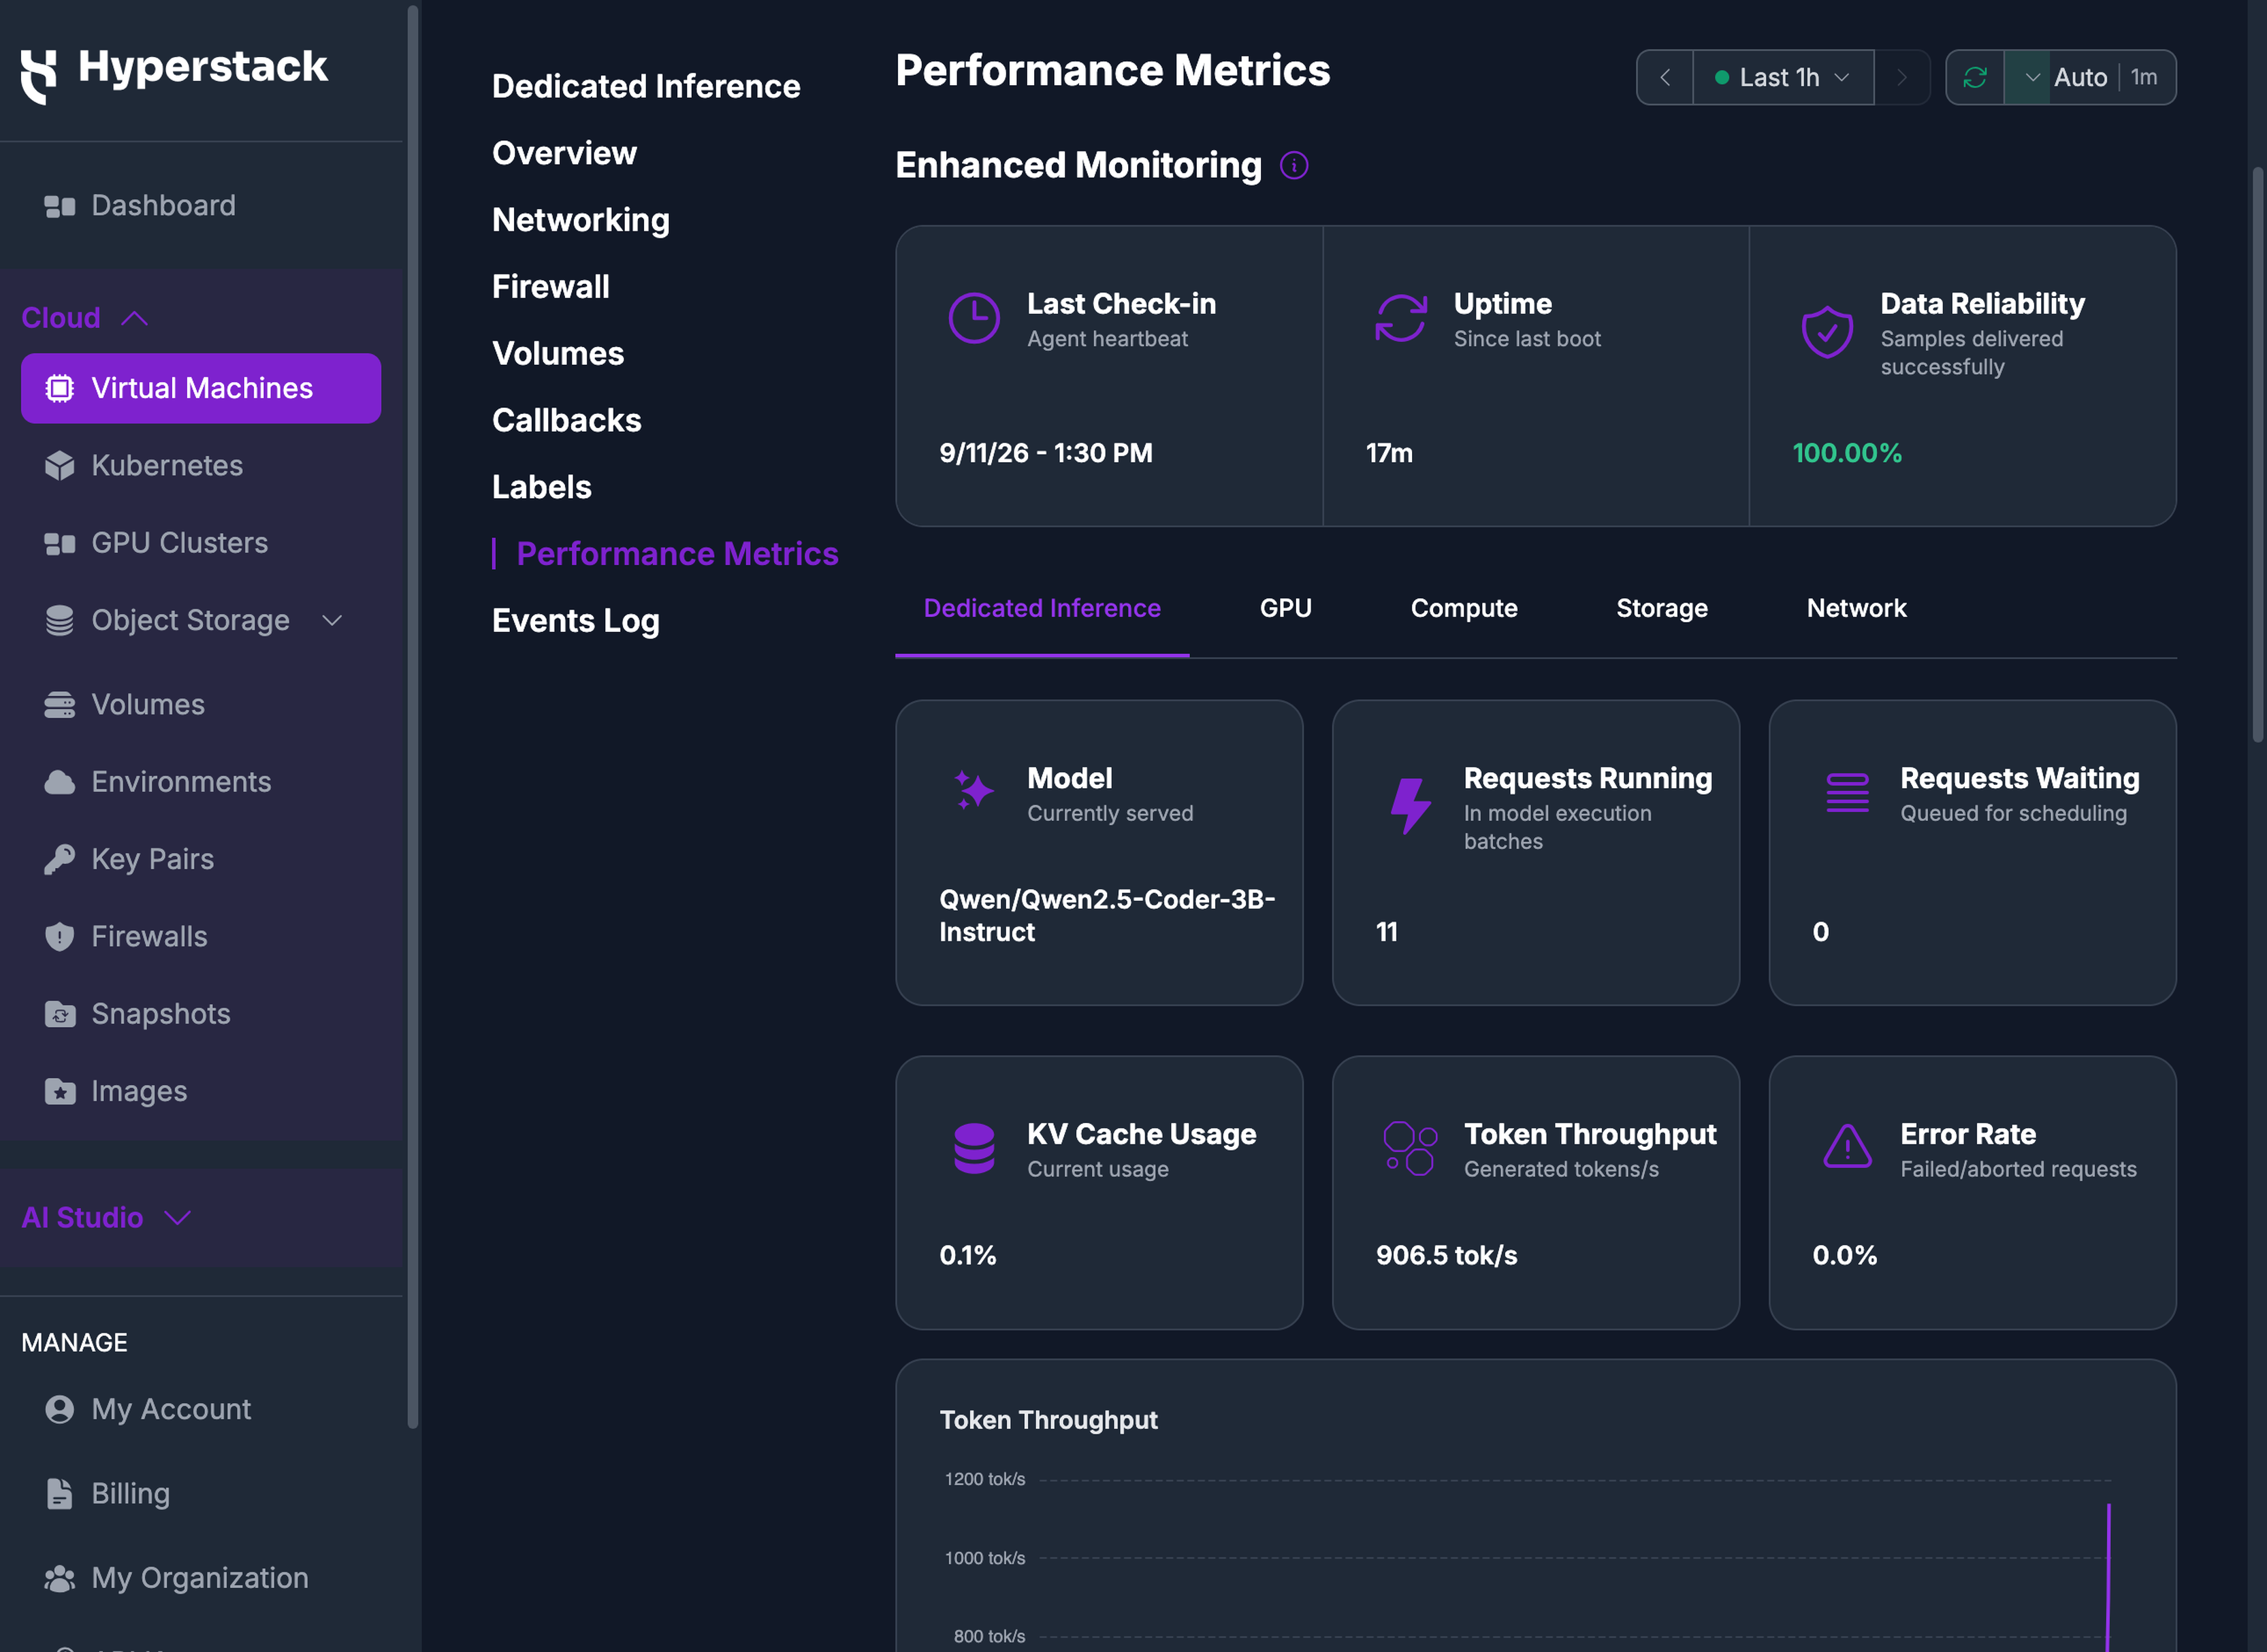
Six values summarise the endpoint:
| Value | What it shows |
|---|---|
| Model | The model the endpoint currently serves |
| Requests Running | Requests in model execution batches right now |
| Requests Waiting | Requests queued for scheduling |
| KV Cache Usage | Share of the key-value cache in use |
| Token Throughput | Output tokens generated per second |
| Error Rate | Share of finished requests that ended in an error, an abort, or a repetition limit |
Four time-series charts follow: Token Throughput, Time to First Token at the 50th, 95th, and 99th percentiles, Requests Running / Waiting, and KV Cache Usage.
Error Rate covers three finish reasons: error, abort, and repetition. A client that disconnects before its response completes is counted as an abort, so the figure moves on client behaviour as well as on serving failures. Requests that finish normally, or that stop because they reached their token limit, are not counted.
Token Throughput measures generated tokens. Prompt tokens are not included, so the figure reflects what the model produces rather than what you send it.
The sub-tab shows a summary. The full set of serving metrics is available through the Grafana integration and the Prometheus-compatible API, where every series is prefixed hyperstack_dedicated_inference_ and carries a model_name label.
Query Metrics from Grafana
Enhanced Monitoring exposes a Prometheus-compatible read API. You can connect any Grafana instance to it and build your own dashboards.
-
Generate an API key
In Hyperstack, navigate to API Keys and generate a new API key. This key authenticates your Grafana queries to the metrics gateway.
-
Add the data source
In Grafana, navigate to Connections → Data sources → Add new data source and select Prometheus.
- Name: any name you like, for example
Hyperstack Enhanced Monitoring - URL:
https://observability.hyperstack.cloud, the Hyperstack metrics gateway - Custom HTTP Headers: add a header named
api-keywith the value of the API key you generated
- Name: any name you like, for example
-
Save and test
Click Save & test. Grafana confirms the connection. You can now build dashboards and run PromQL queries against your VMs' metrics.
Organization IsolationThe metrics gateway scopes every query to the organization you authenticate as, so you never need an
orgfilter.
Each metric carries the following labels you can use to filter and group queries:
| Label | Meaning |
|---|---|
id | VM ID |
instance | VM name |
uuid | Internal VM identifier |
org | Your organization ID, set automatically by the gateway |
region | Region name |
environment | Environment name |
flavor | Flavor of the VM |
cluster | Cluster name, present only on VMs that belong to a cluster |
role | Cluster node role, present only on VMs that belong to a cluster |
collector | The collector that scraped the metric (agent, node, or gpu) |
job | Collector job name, always hyperstack_agent |
GPU metrics carry an additional index and name label per device, so you can filter or sum across the GPUs in a multi-GPU VM.
Dedicated inference metrics carry a model_name label holding the model the endpoint serves. On hyperstack_dedicated_inference_request_success_total, a finished_reason label records how each request ended, with the values stop, length, error, abort, and repetition.
Query Metrics with the Prometheus-compatible API
You can also query metrics directly using the metrics gateway's HTTP API. The gateway is a separate service from the Hyperstack core API, which is where you turn Enhanced Monitoring on and off with the Update Enhanced Monitoring for a virtual machine endpoint.
The gateway accepts two credentials on the query endpoints. Send either an api-key header with your User API key, or an Authorization: Bearer <token> header with a JWT. Send one or the other, never both: a request carrying both is rejected with Provide either API key or bearer token, not both.
The following standard Prometheus endpoints are available. Each endpoint accepts both methods, and they do the same work. Send the parameters as a query string with GET, or as a JSON body with POST. Use POST when a PromQL query is long enough to run into URL length limits.
| Endpoint | Description |
|---|---|
| GETPOST/api/v1/query | Run an instant PromQL query |
| GETPOST/api/v1/query_range | Run a range query |
| GETPOST/api/v1/series | List matching series |
| GETPOST/api/v1/labels | List label names |
| GETPOST/api/v1/label/{label_name}/values | List values for a label |
For example, to check whether the agent on a given VM is reporting:
curl -G \
  -H "api-key: <YOUR_API_KEY>" \
  --data-urlencode 'query=hyperstack_agent_up{id="17521"}' \
  https://observability.hyperstack.cloud/api/v1/query
Replace <YOUR_API_KEY> with your User API key and the id value with your own VM ID.
A query that reaches back further than 90 days is rejected with an HTTP 400 response:
{"detail": "Query time is outside the allowed lookback window of 90 days"}
Disable Enhanced Monitoring
You can return a VM to Standard mode at any time. Hyperstack stops collecting and storing new metrics. The agent stays installed on the VM and enters a disabled state.
-
Open the VM
In Hyperstack, navigate to the Virtual Machines page and click the VM.
-
Disable Enhanced Monitoring
On the Overview tab, scroll to the Enhanced Monitoring card and click Disable. You can also open the ⋮ menu at the top right of the details page and click Disable Enhanced Monitoring.
-
Select Standard mode and save
Select Standard mode and click Save selection. Hyperstack confirms with Standard mode is active. Shortly after, the agent stops collecting and submitting metrics, and the Performance Metrics tab returns to basic metrics.
Re-enabling Does Not Require a ReinstallThe agent is not uninstalled when you return a VM to Standard mode. If you switch back to Enhanced mode later, the agent resumes collecting on its next sync and you do not need to run the install command again.
Limitations
- Supported images: Enhanced Monitoring requires a Linux image running systemd.
- GPU metrics need a GPU flavor and the NVIDIA driver: the agent reads GPU metrics with
nvidia-smi, so both are required. Driver/CUDA pre-installed images work without extra setup. On a bare image, such as Debian or AlmaLinux, install the driver yourself. A VM running a CPU-only flavor, or a GPU VM without the driver, reports everything except GPU metrics. - Per-VM scope: Enhanced Monitoring is enabled and viewed per VM. There is no organization-wide enable.
- Outbound network access: the agent and the installer both need outbound HTTPS access to the Hyperstack metrics gateway.
- 90-day query window: queries cannot read data older than 90 days. Contact support if you need a longer retention window.
- Organization-scoped queries: API and Grafana queries are restricted to VMs in your own organization.