Performance Metrics and Events Log
Insights into virtual machine performance metrics and a log of operational events.
The Performance Metrics and Events Log features in Hyperstack provide comprehensive insights into the performance and operational activities of your virtual machines (VMs). These tools help users monitor and analyze hardware performance, data transfer rates, and event logs to ensure optimal VM performance and security.
Performance Metrics
The VM Performance Metrics page provides detailed information about hardware performance and data transfer rates over a selected time period. Use the Select period dropdown to choose the interval: 1h, 2h, 4h, 6h, 12h, 1d, 3d, 7d, 15d, or 30d.
For per-GPU utilization, temperature, and power draw, or serving metrics on a dedicated inference machine, turn on Enhanced Monitoring, which adds these to the same tab.
How to access Performance Metrics
- In Hyperstack, navigate to the Virtual Machines page to access your VMs. Click on the name of the VM you wish to view performance metrics for.
- In the VM details menu, select Performance Metrics.
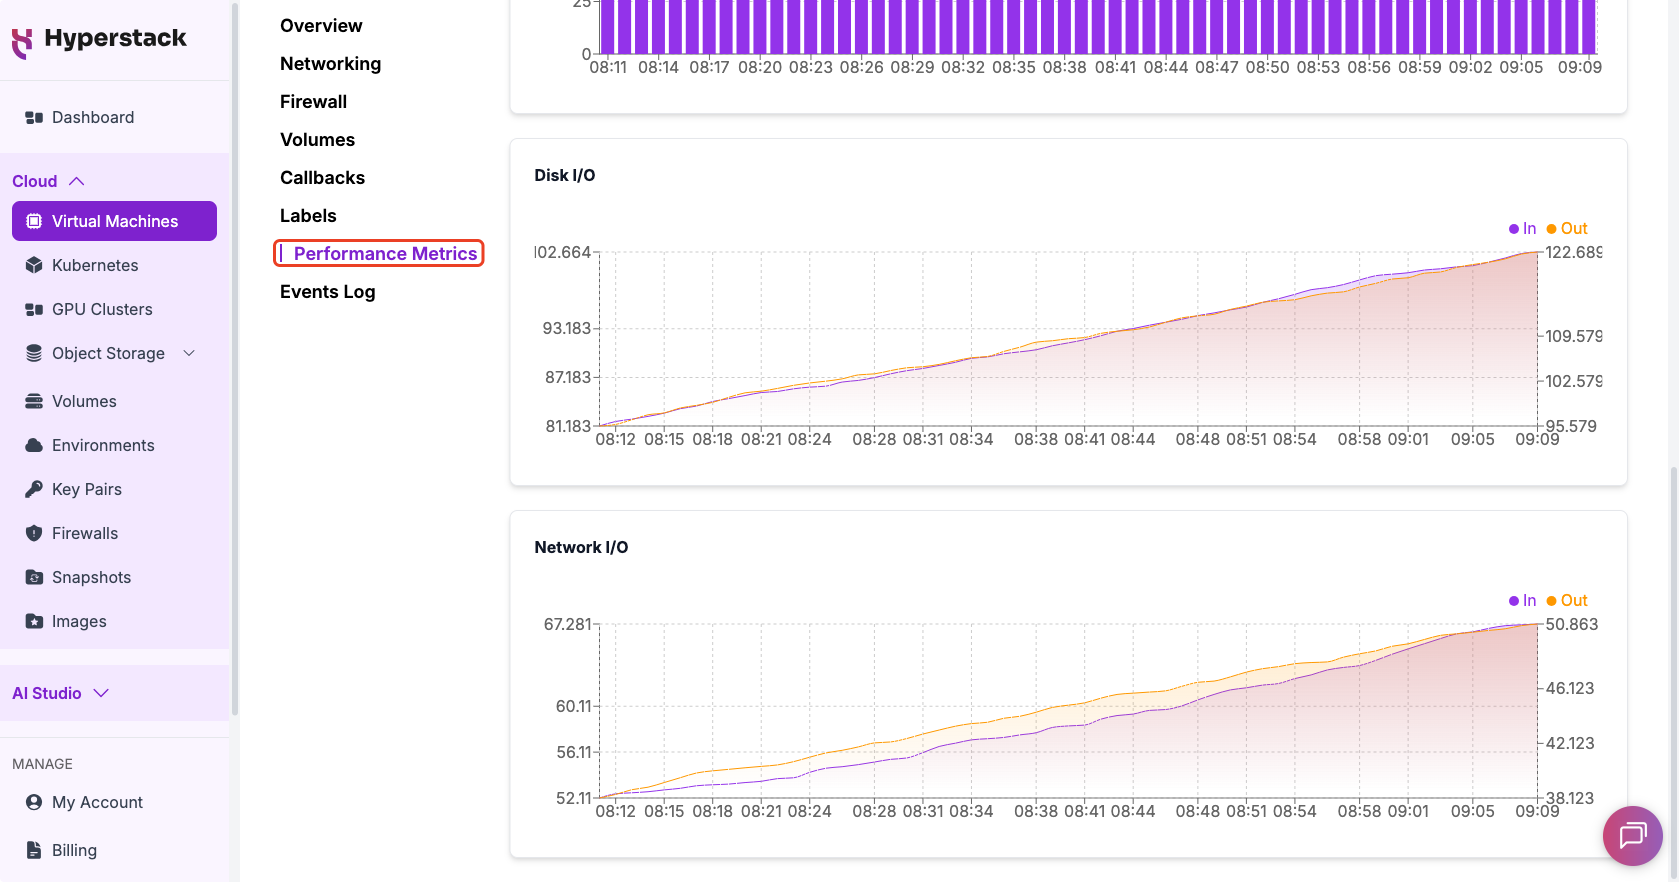
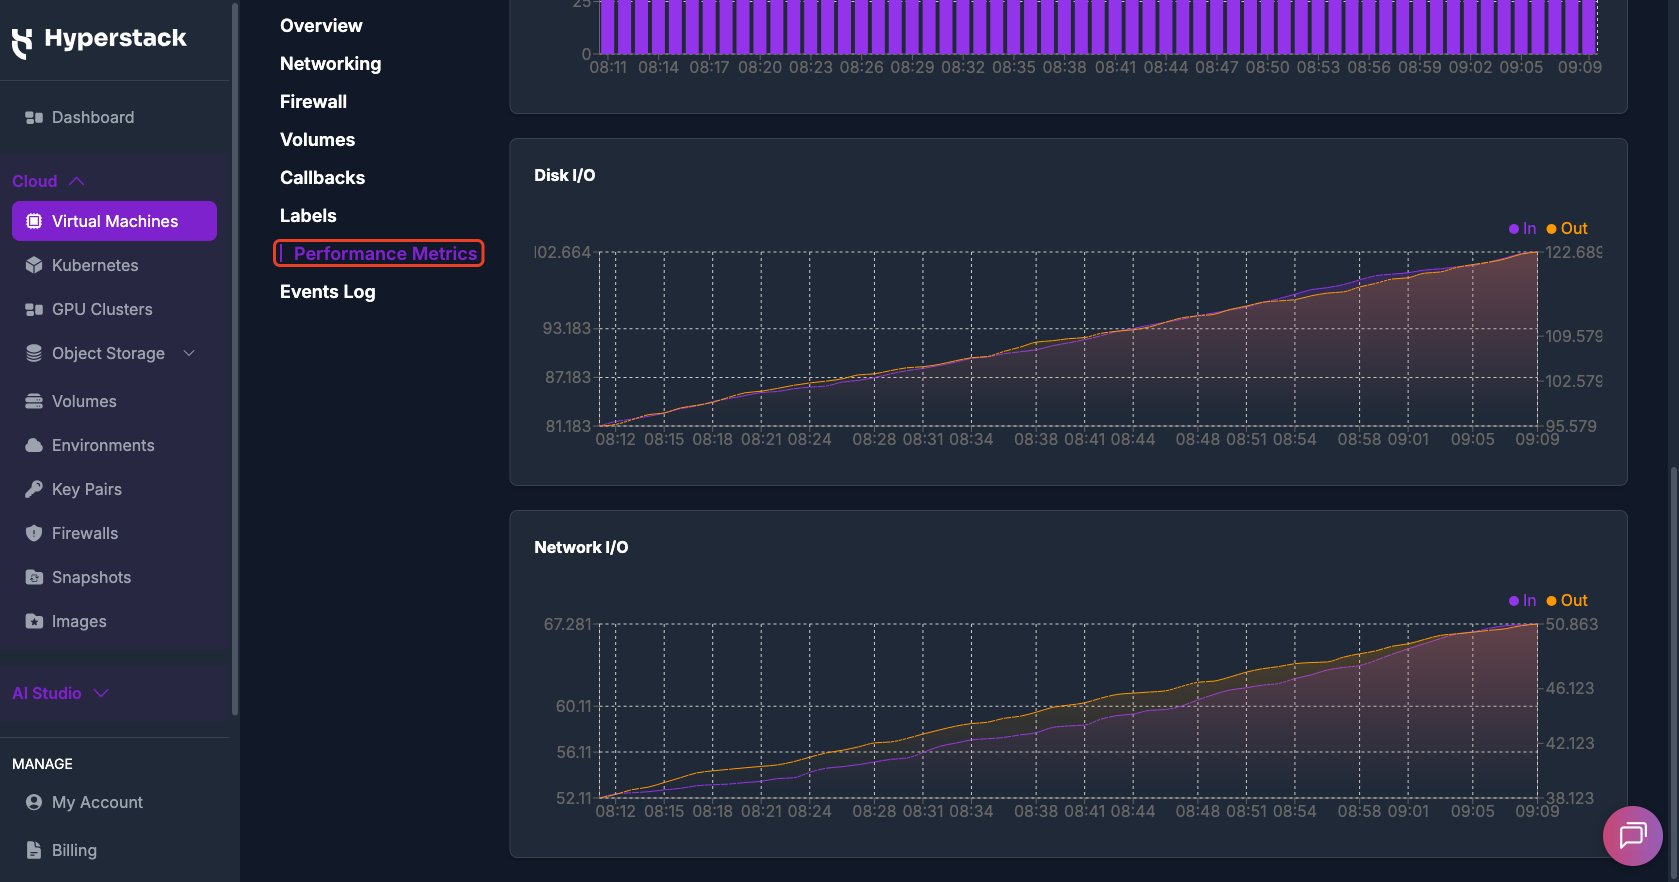
Performance Metrics provided
- CPU %: Indicates the percentage of virtual CPU resources being used by the VM.
- Memory %: Shows the percentage of allocated memory being used by the VM.
- Disk I/O: Measures the amount of data read from and written to the VM's storage. Displayed as either total volume in GB (Cumulative view) or transfer rate in MB/s (Delta view).
- Network I/O: Measures the amount of data sent and received over the network by the VM. Displayed as either total volume in GB (Cumulative view) or transfer rate in MB/s (Delta view).
To monitor the performance of your VM's GPUs, use the nvidia-smi command. To learn more, click here.
Cumulative and Delta views
Disk I/O and Network I/O can each be displayed in two views. Use the Select view dropdown at the top of the Performance Metrics page to switch between them. The charts update immediately, without reloading the page:
- Cumulative (default): Shows the total accumulated value over the selected time period, measured in GB. This view is useful for tracking overall usage and historical totals.
- Delta: Shows the rate of change between consecutive data points, normalized over time and measured in MB/s. This view is useful for monitoring real-time throughput and identifying spikes or anomalies in activity.
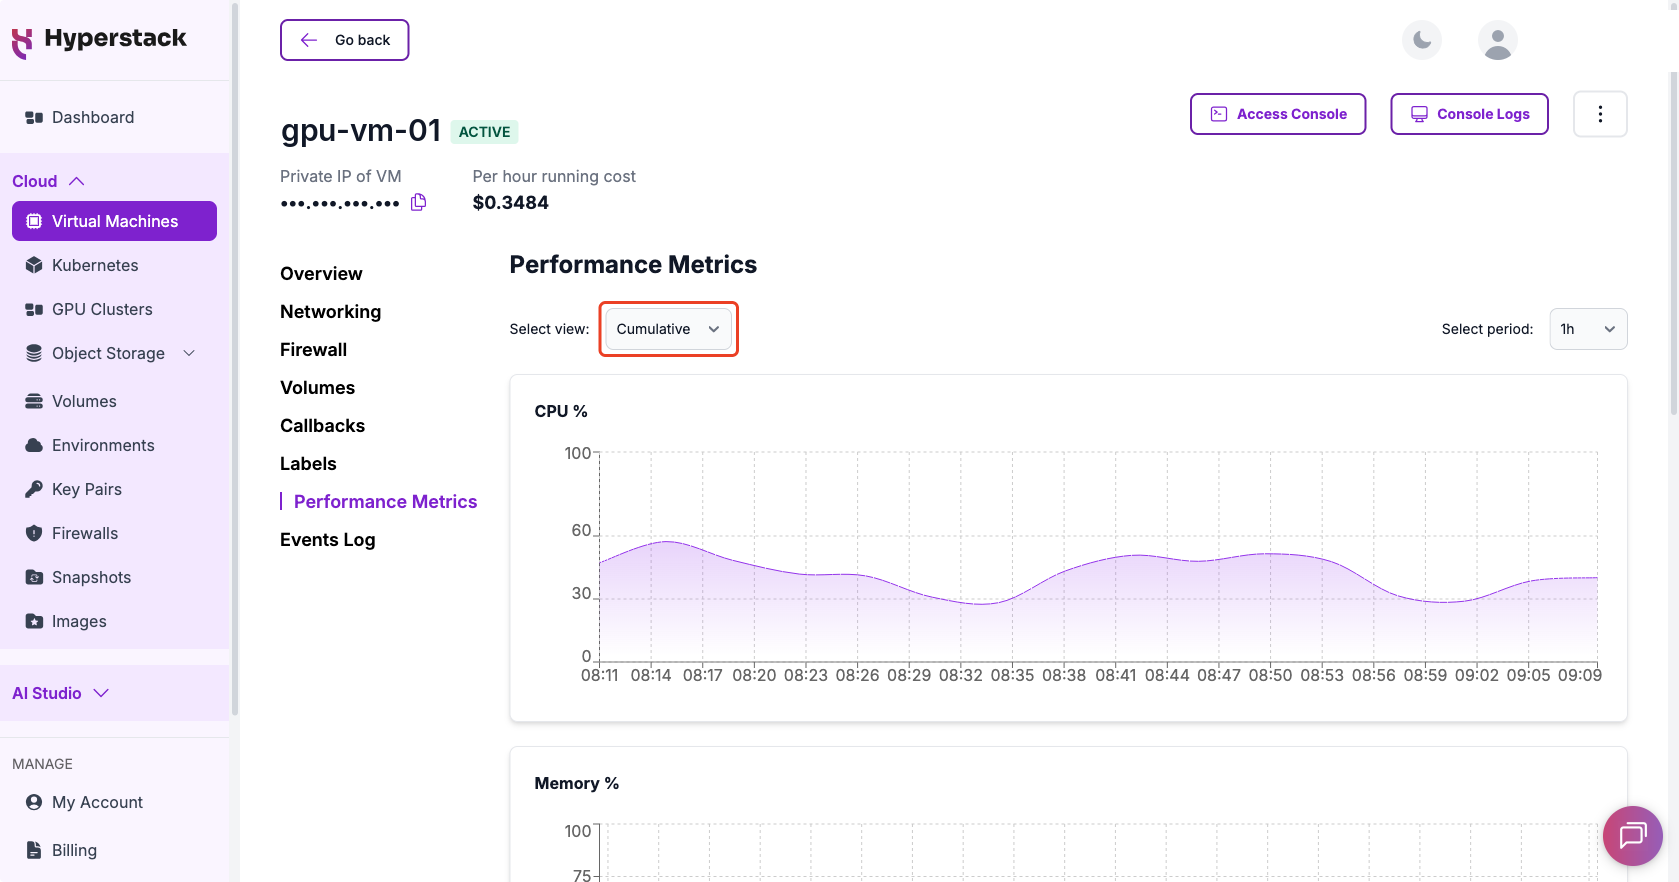
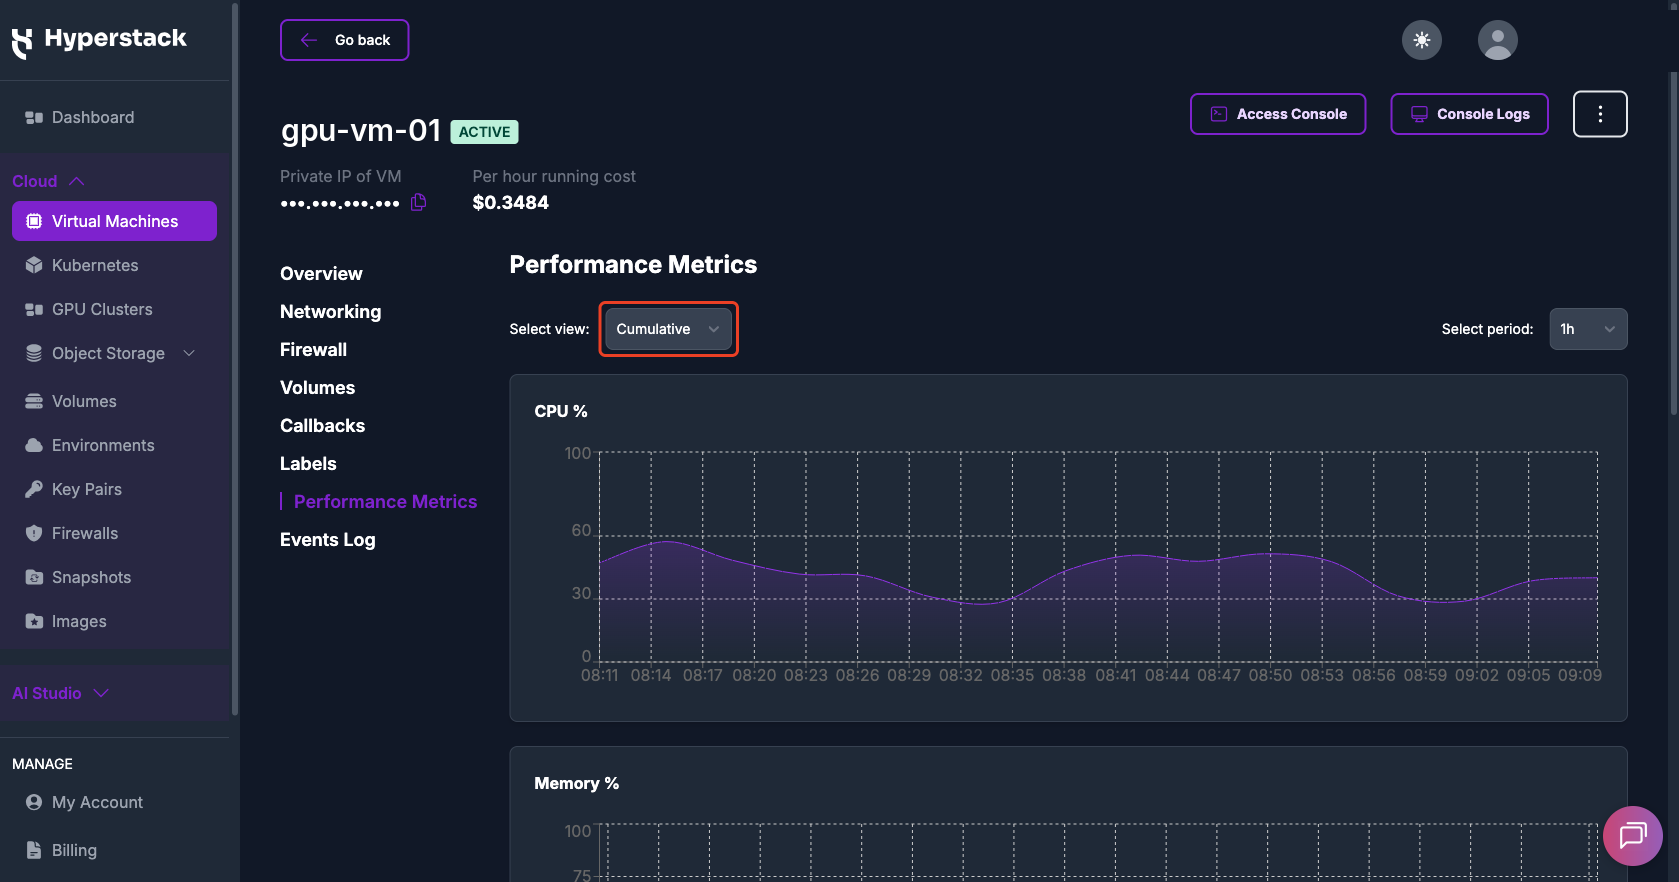
The Cumulative and Delta setting applies only to Disk I/O and Network I/O. CPU % and Memory % are unaffected: CPU usage is already reported as a rate, and memory usage is a point-in-time value rather than a cumulative one.
Events Log
The VM Events Log page provides a detailed log of all events and actions that have occurred on your virtual machine. This log includes information about changes in firewall rules, reboots, and other significant actions, along with timestamps and user details.
Event details provided:
- Timestamp: The exact date and time when the event occurred.
- User: The username of the person who performed the action responsible for the event.
- Type: The classification of the event, indicating its nature (e.g., normal or error).
- Reason: A brief description of why the event was triggered.
- Object: The specific VM or resource affected by the event.
- Message: Additional information about the event.
Steps to access Events Log:
- In Hyperstack, navigate to the Virtual Machines page to access your VMs. Click on the name of the VM you wish to view event history for.
- In the VM details menu, select Events Log.
Performance Metrics and Events History APIs
APIs for retrieving virtual machine metrics data and the history of events executed on a VM..
| Endpoint Name | URL | Description |
|---|---|---|
| Retrieve virtual machine performance metrics | GET/core/virtual-machines/{id}/metrics | Retrieves performance metrics data for a virtual machine. |
| Retrieve virtual machine events history | GET/core/virtual-machines/{id}/events | Retrieves history of events for a virtual machine. |